Subgraphs are useful to represent different
levels of a hierarchy in a single diagram and to view each level
separately. As an example, you can have the following levels in a
network diagram: regions, nodes, and equipment.
To create subgraphs:
-
Open the network example which you laid out in the previous section by clicking File > Open and selecting the project file
network2.idprif it is not still open.In this example, there is only the node level. To show the use of subgraphs, you can create a regional level. -
Enable subgraphs by clicking Edit > Options in Style Editing Mode and checking Subgraphs.
-
Switch to Diagram Editing mode by clicking the middle icon in the vertical toolbar.
-
Move the nodes so that Frankfurt is vertically above Paris.
-
Drag the mouse around these two nodes and click the Group Selection icon in the toolbar
 .
This creates a subgraph containing the group of nodes. On creation, the subgraph is selected and expanded, see the following figure.
.
This creates a subgraph containing the group of nodes. On creation, the subgraph is selected and expanded, see the following figure.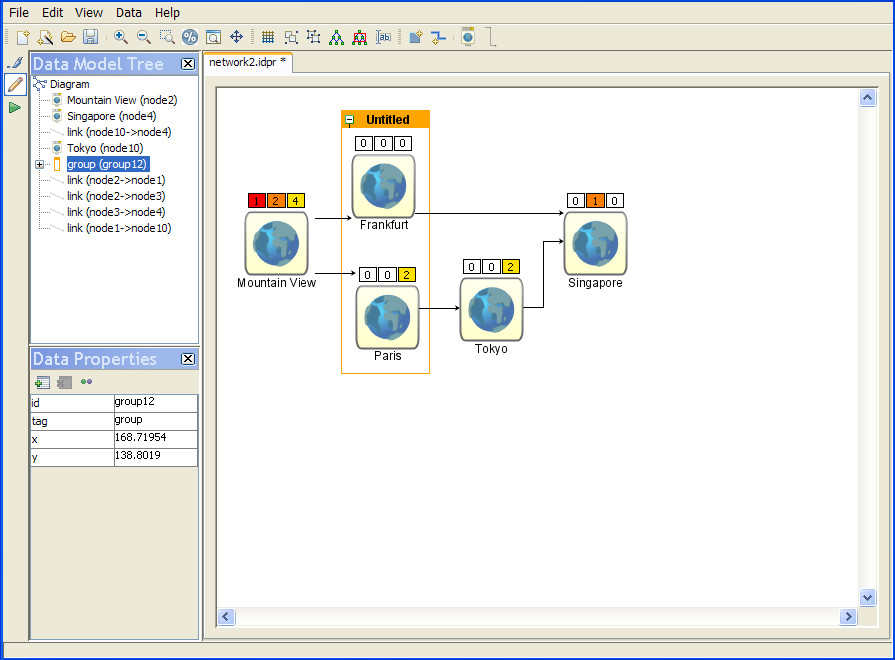 An expanded group containing nodes
 -
Select Singapore.
-
Press Shift and click Tokyo to add it to the selection.Do not drag to select this time because that would include the link between these two nodes in the selection.
-
Click the Group Selection icon in the toolbar to create a second subgraph.