The legend is an explanatory table listing
graphic symbols and explaining their meanings.
Switch back to Style Editing mode by clicking the Style Editing
button  in the vertical
toolbar.
in the vertical
toolbar.
in the vertical
toolbar.
To add a legend to your diagram:
-
Click Edit > Options.
-
Check the Legend check box.
-
Click OK.The Legend option adds a legend to your diagram.
The Legend window can be inlaid within
the diagram or can be an independent window, see the following
figure.
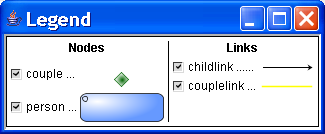
A separate legend window
To display the legend as an independent
window:
-
Clear the Inlaid option in the Position tab of the Styling Customizer.
By default, the legend shows two columns,
one for nodes and one for links, with an entry for each
user-defined type.
You can customize the general appearance,
the position, and the contents of the legend.
To customize the general appearance of
the legend:
-
Select Legend under Options in the Style Rules pane.
-
In the Styling Customizer, use the Display tab to customize the font, spacing, and colors of the legend.
To customize the position of the
legend:
-
Select Legend under Options in the Style Rules pane.
-
In the Styling Customizer, use the Position tab to customize the position of the legend.
To customize the legend contents:
-
Select Legend under Options in the Style Rules pane.
-
In the Styling Customizer, use the buttons in the Columns tab, see the following figure.
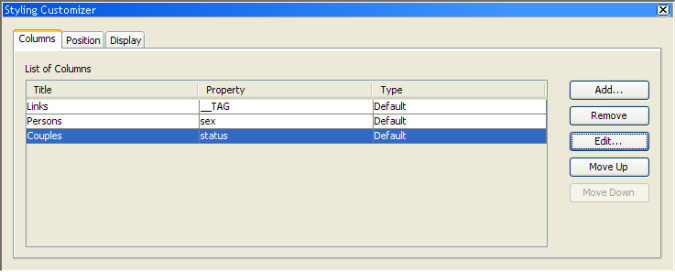
Customizing a legend
A possible customized legend is shown in
the following figure.
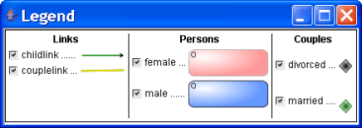
A customized legend
The customized legend has the following
features:
- A different title for the column
Nodes:Persons, created with the Edit button in the Styling Customizer, and customized to use thesexproperty. - An extra column for Couples, created with the Add button in the Styling Customizer, and customized as before to use the
statusproperty
Filtering
The Legend provides a filtering
function.
For example, in the Legend, clear a
check box and the nodes or links of that type disappear.