Zooming in on LA
-
Click the
 button, then click and hold the left mouse button on Los
Angeles, for example. The map zooms in continuously on the
point you have clicked. Do this until the map is zoomed in
on Los Angeles.
NoteTo zoom out, press and hold the right mouse button. To pan, press and drag the mouse. The zoom operation pauses as the map pans to the area you want to see.The following figure shows the resulting Map View pane
button, then click and hold the left mouse button on Los
Angeles, for example. The map zooms in continuously on the
point you have clicked. Do this until the map is zoomed in
on Los Angeles.
NoteTo zoom out, press and hold the right mouse button. To pan, press and drag the mouse. The zoom operation pauses as the map pans to the area you want to see.The following figure shows the resulting Map View pane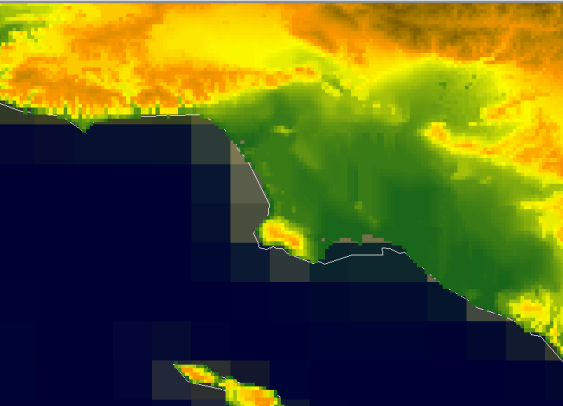 The Data Source GTOPO30-DEM W140N40-DEM
Adding LA house information
-
Choose File>Add Map Data to open the file browser, select the GeoTIFF format, and then select the drive where you downloaded and saved your data. For example, select the data source
LA_Houses.tif, and then choose Open. -
Drag and drop the GeoTIFF layer to the bottom of the Map Layers pane, open the hierarchy, and click the
LA_Houses.tifdata source to select it. -
Click the
 button to zoom
the whole
button to zoom
the whole
LA_Houses.tiflayer into the Map View pane. -
Click the
 button, and zoom
in on the part of
button, and zoom
in on the part of
LA_Houses.tifthat is of interest. Now zoom in or out using the zoom in\out slider in the Overview pane, until the houses are displayed at the scale you want.The following figure shows the resulting Map View pane.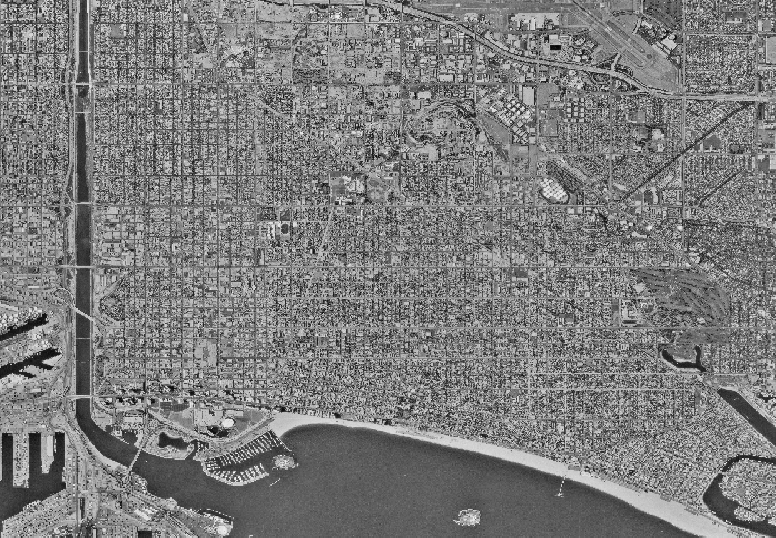 The data source LA_Houses
Adding LA street information
-
Choose File>Add Map Data to open the file browser, select the ESRI/Shape format, and then select the drive where you downloaded and saved your data. For example, select the data source
LA_Streets.shpand then choose Open. -
Select the
Line Colorproperty and set theLine Colorvalue to white using the Color Editor displayed.The following figure shows the resulting Map View pane.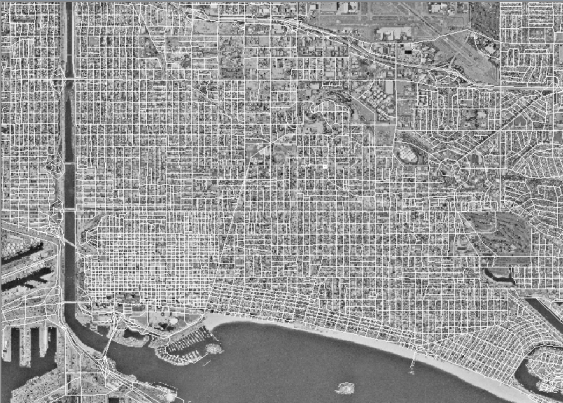 The data source LA_Streets
 -
Choose Option>Show Tooltips on the Map to enable the display of tooltips when you move the mouse pointer over the map.
-
Click the button, and zoom
in on the part of the
LA_Houses.tifandLA_Streets.shpdata sources that are of interest to you.The following figure shows the resulting Map View pane.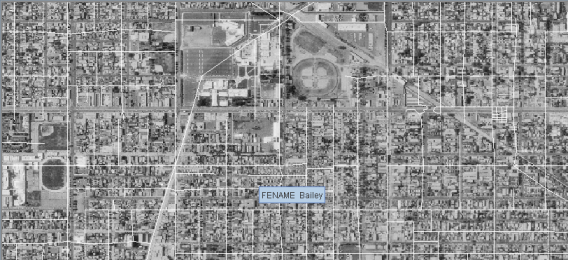 LA_Streets and LA_Houses