Creating a basic treemap chart
A treemap displays entities in such a way that important entities stand out visually and the less important ones are visually insignificant. A treemap is optimal for getting an overview of all entities and for spotting particular ones with extraordinary characteristics.
The data to be represented is the expenses of a fictive company. Data has the shape of a tree table, where objects are organized in a tree structure with several values per object, as illustrated in
Example of Expenses Organized in a Tree Structure.
Example of Expenses Organized in a Tree Structure
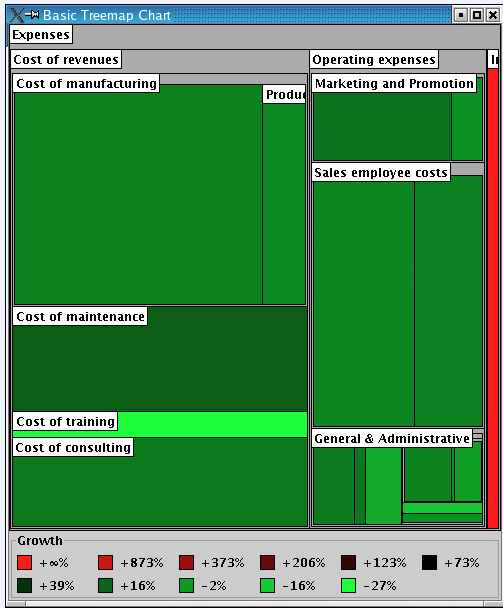
A treemap chart displays objects as rectangles. The important objects are represented by large rectangles while the less important objects are represented by smaller rectangles.
Rectangles relate each other in a containment structure, where each rectangle is part of another rectangle.
Example of Treemap Chart shows the treemap chart that will be created to display your data.
Example of Treemap Chart
Creating the data model
The data model, among those offered in the packages
ilog.views.chart.data and
ilog.views.chart.datax, that best matches the tree structure is the
IlvTreeListModel. The
IlvTreeListModel can be found in the
ilog.views.chart.datax package.
To create the data model, you first need create the objects that represent the data and then create an instance of the
IlvDefaultTreeListModel and add objects to it.
1. Create the objects.
The objects in the model have a name and two numerical attributes: the amount of expenses in the years 2004 and 2005. You will also use a computed attribute: the growth from 2004 to 2005.
class ExpenseItem { private String name;
private double amount2004; private double amount2005;
/** * Creates an expense item without associated amounts. */
public ExpenseItem(String name) { this.name = name;}
/** * Creates an expense item with associated amounts. */
public ExpenseItem(String name, double amount2004, doubleamount2005)
{ this.name = name;
this.amount2004 = amount2004;
this.amount2005 = amount2005; }
/** * Returns the amount for the year 2004, or 0 if none. */
public double getAmount2004() { return this.amount2004; }
/** * Returns the amount for the year 2005, or 0 ifnone. */
public double getAmount2005() { return this.amount2005; }
/** * Returns the growth factor from 2004 to 2005. */
public double getGrowth() { if (this.amount2004 != 0) return this.amount2005 / this.amount2004;
else if (this.amount2005 > 0) return Double.POSITIVE_INFINITY;
else if (this.amount2005 < 0) return Double.NEGATIVE_INFINITY;
else return Double.NaN; }
/** * Returns the string representation of this object.
* For simplicity, we use the name here. */
public String toString() {return this.name; } }
2. Enumerate the object properties.
Every attribute of the
ExpenseItem class corresponds to a column in the tree-table, illustrated in
Example of Expenses Organized in a Tree Structure. Each attribute of a particular object in the tree corresponds to a table cell in the right part of the tree table.
IlvDataColumnInfo amount2004Column = new IlvDefaultDataColumnInfo("Amount 2004", Double.class);
IlvDataColumnInfo amount2005Column = new IlvDefaultDataColumnInfo("Amount 2005",
Double.class);
IlvDataColumnInfo growthColumn = new IlvDefaultDataColumnInfo("Growth",
Double.class);
IlvDataColumnInfo[] columns = new IlvDataColumnInfo[]
{ amount2004Column, amount2005Column, growthColumn };
You will also need the indices of the columns:
static final int amount2004Index = 0;
static final int amount2005Index = 1; static final int growthIndex = 2;
3. Create the model class.
Now you are ready to create the model. It will access the methods of the
ExpenseItem class. If you instantiate
IlvDefaultTreeListModel without any overrides, the storage of the attribute values would be in the
IlvDefaultTreeListModel. However, since you want the attribute values is derived from the values of the methods
getAmount2004(),
getAmount2005(), and so on, you override the corresponding methods from
IlvDefaultTreeList.
class ExpensesModel extends IlvDefaultTreeListModel
{ public ExpensesModel(IlvDataColumnInfo[] columns) { super(columns); }
public double getDoubleAt(Object object, int columnIndex) { switch (columnIndex)
{ caseamount2004 Index: return ((ExpenseItem)object).getAmount2004();
case amount2005Index: return ((ExpenseItem)object).getAmount2005();
case growthIndex: return ((ExpenseItem)object).getGrowth();
default: throw new IllegalArgumentException("invalidcolumn"); }
}
public Object getValueAt(Object object, int columnIndex) { switch (columnIndex)
{ case amount2004Index: case amount2005Index: casegrowthIndex:
return new Double(getDoubleAt(object, columnIndex));
default: throw new IllegalArgumentException("invalidcolumn"); }
}
public void setDoubleAt(double value, Object object, int columnIndex)
{ throw new UnsupportedOperationException("thevalues are read-only"); }
public void setValueAt(Object value,Object object, int columnIndex)
{ throw new UnsupportedOperationException("thevalues are read-only"); }
}
4. Instantiate the model.
Instantiate the model and fill it with your data.
ExpensesModel model = new ExpensesModel(columns);
ExpenseItem root = new ExpenseItem("Expenses");
model.setRoot(root);
{ ExpenseItem kind;
kind = new ExpenseItem("Costof revenues");
model.addChild(kind, root);
{
ExpenseItem purpose; purpose = new ExpenseItem("Costof manufacturing");
model.addChild(purpose, kind);
model.addChild(new ExpenseItem("Materials and Supplies",580, 611), purpose);
model.addChild(new ExpenseItem("Productionwages", 101, 104), purpose);
purpose = new ExpenseItem("Costof maintenance", 271, 324);
model.addChild(purpose, kind);
purpose = new ExpenseItem("Cost of training", 110, 80);
model.addChild(purpose, kind);
purpose = newExpenseItem("Cost of consulting", 250, 270);
model.addChild(purpose,kind);
}
kind = new ExpenseItem("Operating expenses");
model.addChild(kind, root);
{
ExpenseItemkind1;
kind1 = new ExpenseItem("Marketing and Promotion");
model.addChild(kind1, kind);
model.addChild(newExpenseItem("Marketing employee costs", 120, 133), kind1);
model.addChild(new ExpenseItem("Marketing campaigns", 30, 30),kind1);
kind1 = new ExpenseItem("Sales employee costs");
model.addChild(kind1, kind);
model.addChild(newExpenseItem("Sales employee salaries", 279, 291), kind1);
model.addChild(new ExpenseItem("Sales commissions", 184, 195),kind1);
kind1 = new ExpenseItem("General & Administrative");
model.addChild(kind1, kind);
model.addChild(newExpenseItem("Finance department", 40, 43), kind1);
model.addChild(newExpenseItem("Legal department", 11, 12), kind1);
model.addChild(newExpenseItem("Management Information Systems", 40, 37), kind1);
{ ExpenseItem facilities = new ExpenseItem("Facilities");
model.addChild(facilities, kind1);
{ ExpenseItem office = new ExpenseItem("Officeexpenses");
model.addChild(office, facilities);
model.addChild(new ExpenseItem("Rental", 38, 40),office);
model.addChild(new ExpenseItem("Electricity",2, 2), office);
model.addChild(new ExpenseItem("Otheroffice expenses", 24, 23), office); }
model.addChild(new ExpenseItem("Telecommunication", 13, 11), facilities);
model.addChild(new ExpenseItem("Other facilities",9, 9), facilities);
}
}
kind = new ExpenseItem("FinancialInterests", 6, 5);
model.addChild(kind, root);
kind= new ExpenseItem("Income Taxes", 0, 49);
model.addChild(kind,root);
}
5. Create the data source.
You need to create a data source view of the model, so that you can connect it to the chart. To do this, use the following code:
IlvTreeTableDataSource dataSource = new IlvTreeTableDataSource(model);
Creating a treemap chart with renderers
To display a treemap chart, you need an instance of
IlvChart and an instance of
IlvTreemapChartRenderer set on the
IlvChart and connected to your data source.
To do this, you can proceed in two different ways:
1. Allocate the chart and the renderer, and connect the renderer to the data source.
IlvChart chart = new IlvChart();
IlvTreemapChartRendererrenderer = new IlvTreemapChartRenderer();
renderer.setDataSource(dataSource);
// Here you can customize the renderer. chart.addRenderer(renderer);
2. Allocate the chart only, and connect the chart to the data source.
// Allocate a chart that will show treemaps by default.
IlvChart chart = new IlvChart(IlvChart.TREEMAP);
// Connect the chart to the data source. The chart automatically
// creates the appropriate renderer.
chart.setDataSource(dataSource);
// You can fetch the implicitly created renderer and customize it.
IlvTreemapChartRendererrenderer = (IlvTreemapChartRenderer)chart.getRenderer(0);
Copyright © 2018, Rogue Wave Software, Inc. All Rights Reserved.