Loading data from data sources
Describes how to create a chart by loading new data from various data sources.

Describes how to load data from an existing text file (comma-separated or tab-separated values).
Explains how to retrieve data stored in a database.
Explains how to retrieve data from in-memory data source.
Loading data from a flat file
For more information on the flat file data source, see
Populating the chart. in
Introducing JViews ChartsLoading data from a flat file
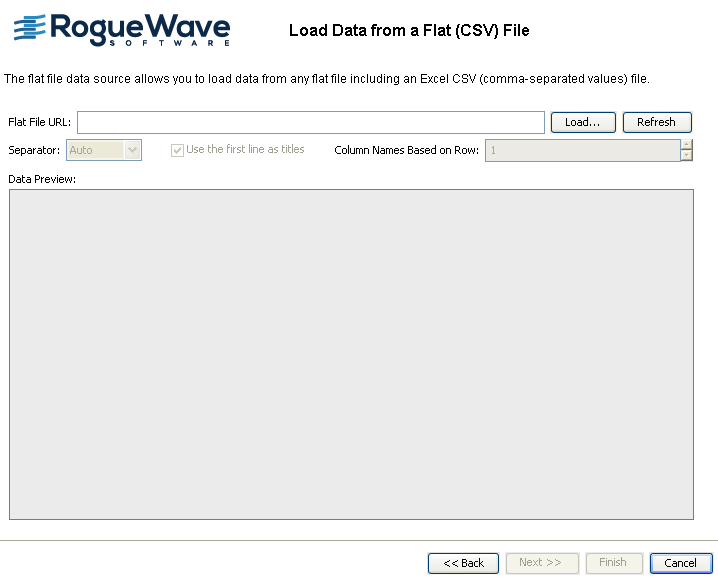
1. Click File > New from Wizard.
2. Click Start From Basic Elements and Next.
3. Select Flat File and click Next.
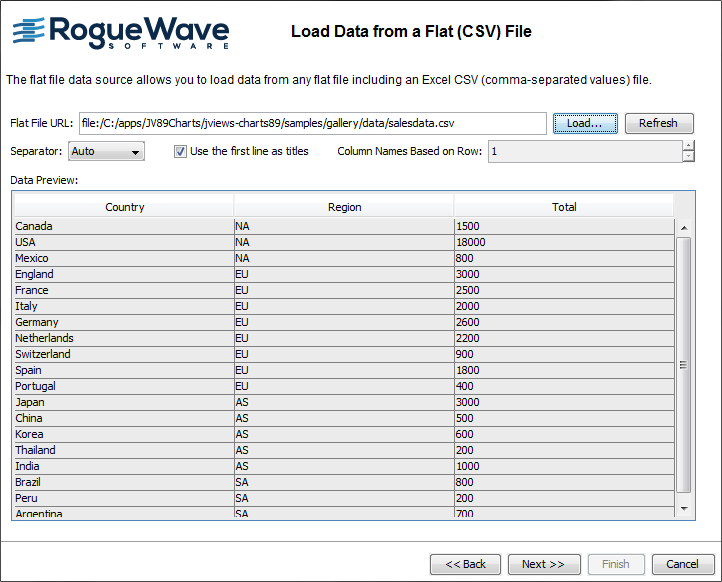
4. Browse to salesdata.csv file and click Open.
5. Click Next to continue.
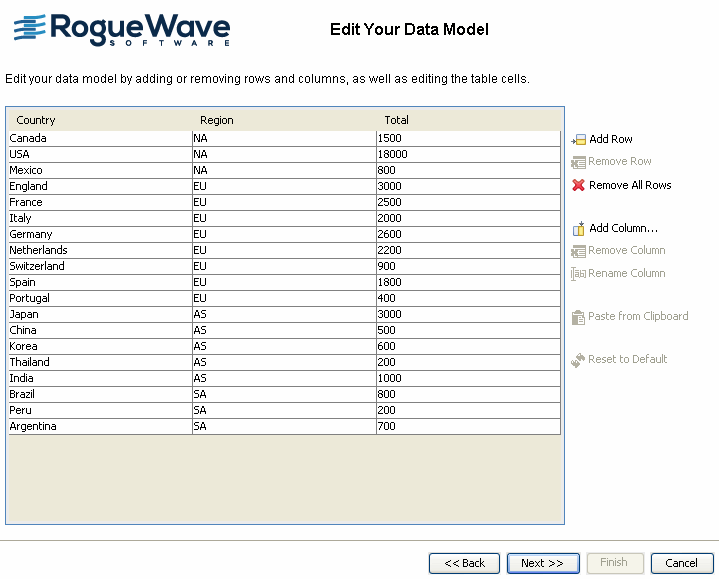
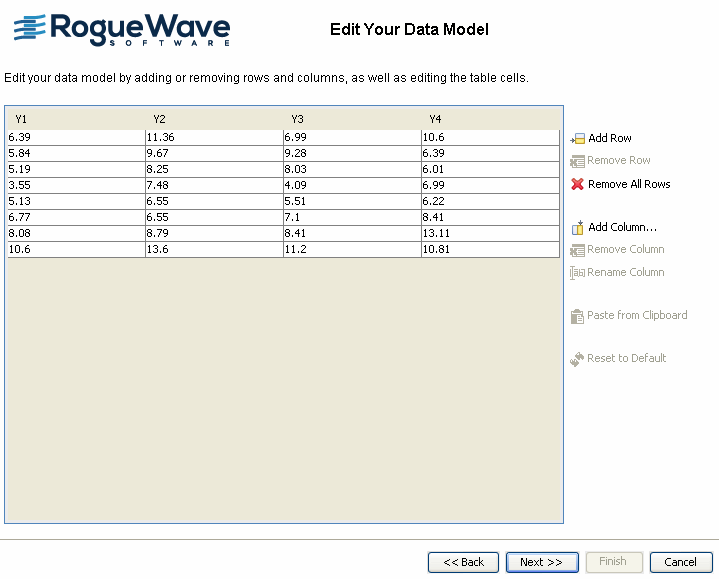
Editing your data model
You are going to edit the data model by removing the column Region.
1. Select the column Region by clicking one of its cells and then click the Remove Column button.
2. Click Next to continue.
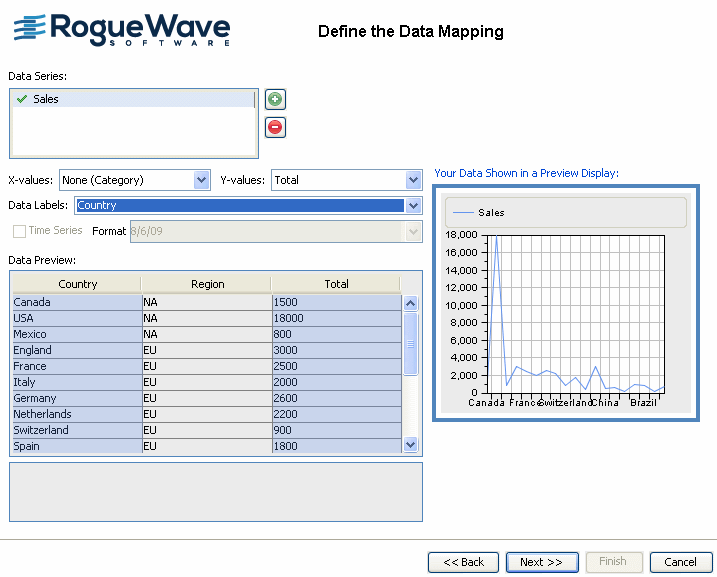
Defining the data mapping
The data mapping defines which columns of the table should be used for the display of the chart and in which role. The data mapping is an association between the columns of the table and a list of data series. Each data series is composed of the following elements:
a column of Y values (mandatory)
a column of X values (optional)
a column of data labels (optional)
The order of the data series is important: the data series are drawn in the same order, so that the last data series appears on top of the others.
To create a new series you have to click the

button, rename the data series newly created and choose the table column(s) to which it corresponds. For the X and Y values of a data series you can only choose a numerical column; for the labels you can use a non-numerical column.
The data mapping is complete when all the columns containing the data that you want to view are mapped to data series. You are going to add a new series and call it Sales.
1. To add a new series click the
button.
2. Double-click the “New Series 1” in the Data Series field, rename it Sales and press Enter to validate.
3. In the Y-values field select Total.
4. In the Data Labels field select Country.
5. Click Next to continue.
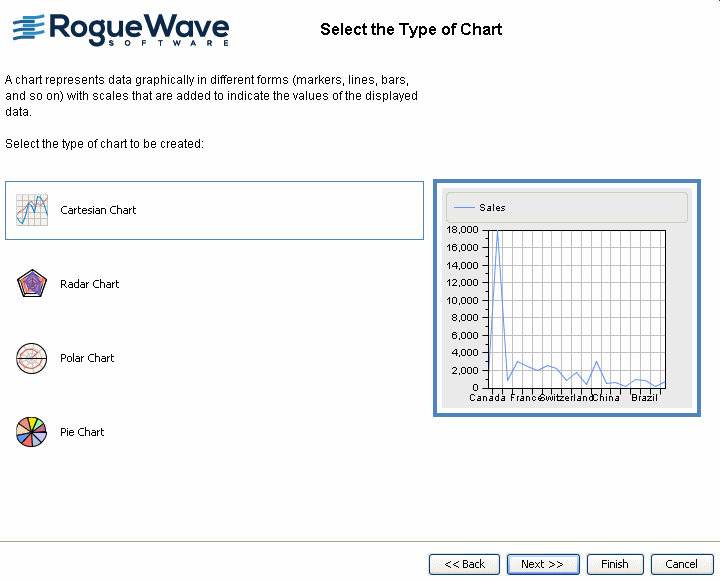
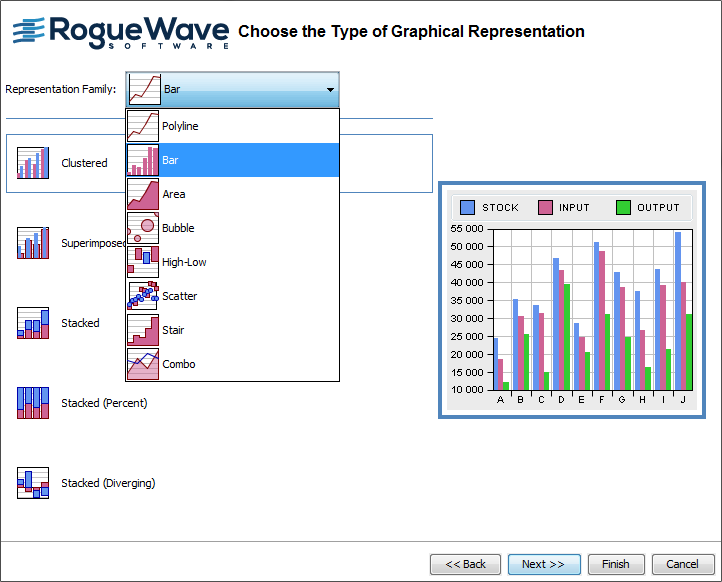
Selecting the type of chart
1. Create a Cartesian chart.
2. Select the option Create a Cartesian chart and click Next.
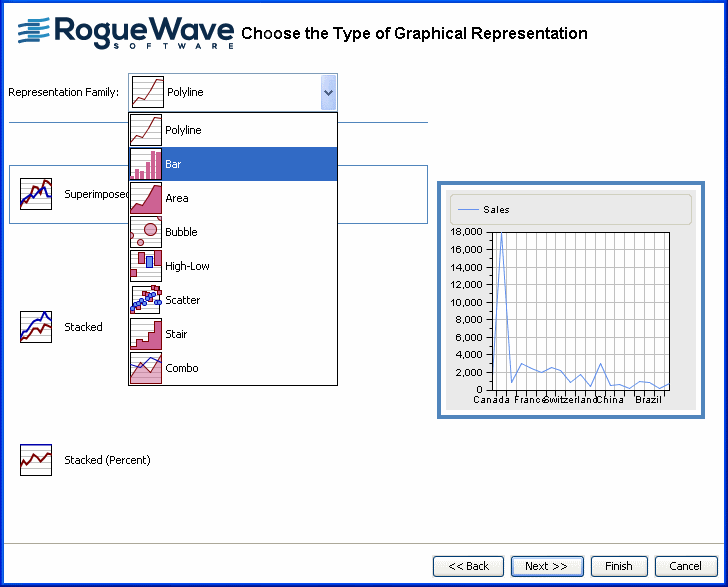
3. From the Representation Family list, select the option Bar.
4. Select the option Clustered and click Next.
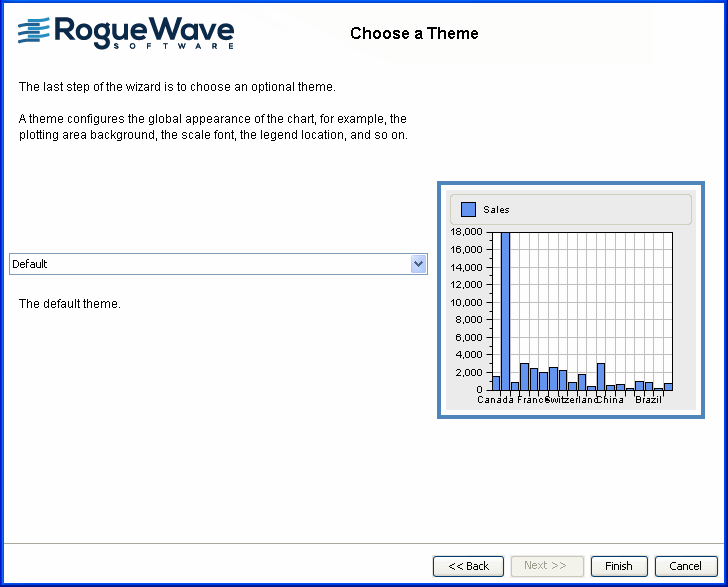
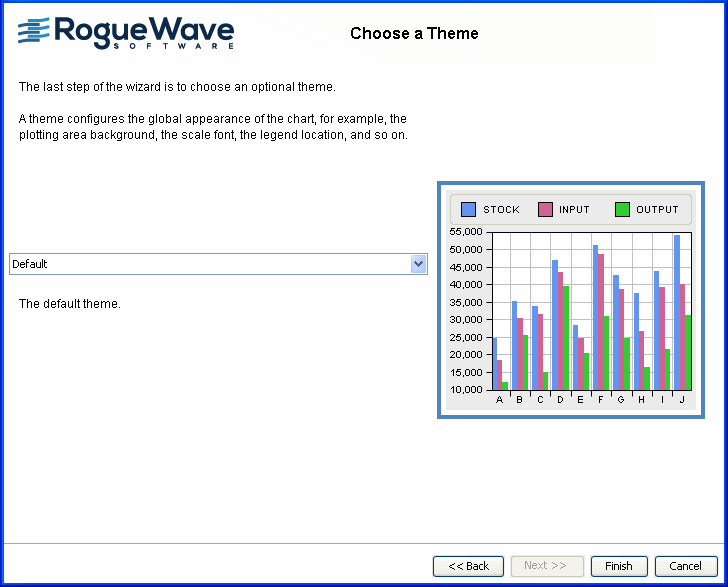
Choosing a theme
1. For this example, you can leave the Default theme.
2. Click Finish to end the wizard session.
If you need to make changes, you can click Back instead to return to specific wizard pages.
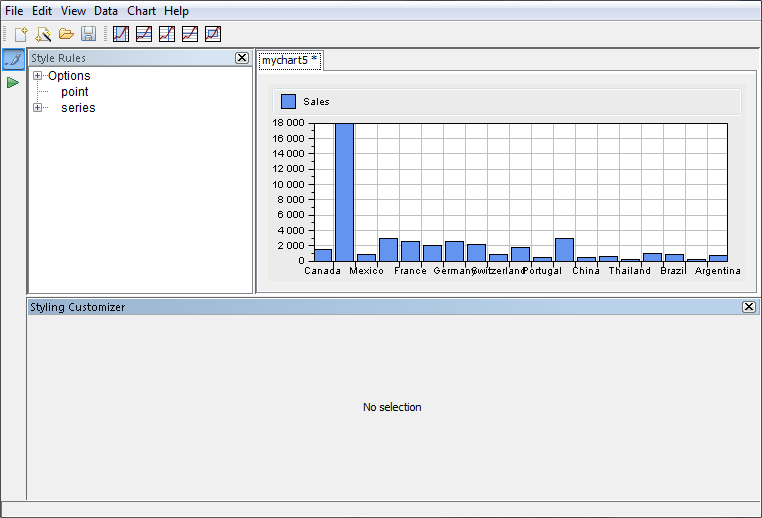
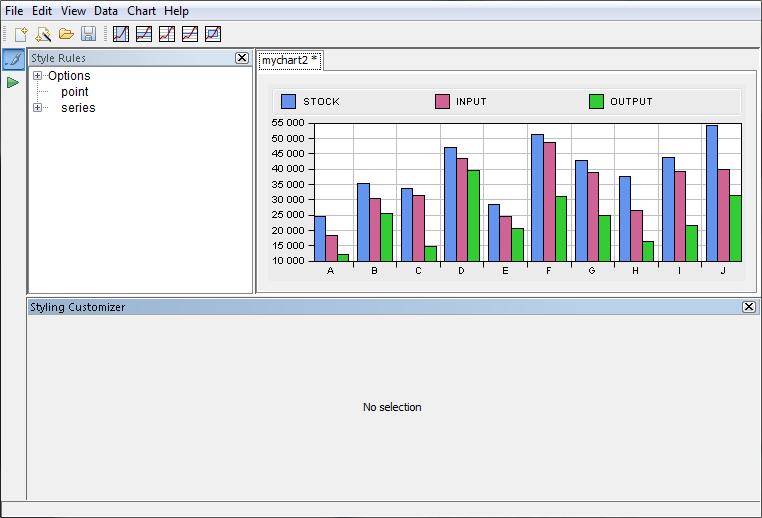
The resulting chart should appear in the Designer, as follows:
Loading data from a database (JDBC)
Rogue Wave®
JViews Charts supports the use of the JDBC interface to retrieve data value from database servers. For more information on the database data source, see
Populating the chart. in
Introducing JViews Charts. You can also find more information about JDBC on the JavaSoft site at:
http://java.sun.com/products/jdbc.
Loading data from a database
1. Choose File>New from Wizard.
2. Select Start From Basic Elements and then the Database (JDBC) option.
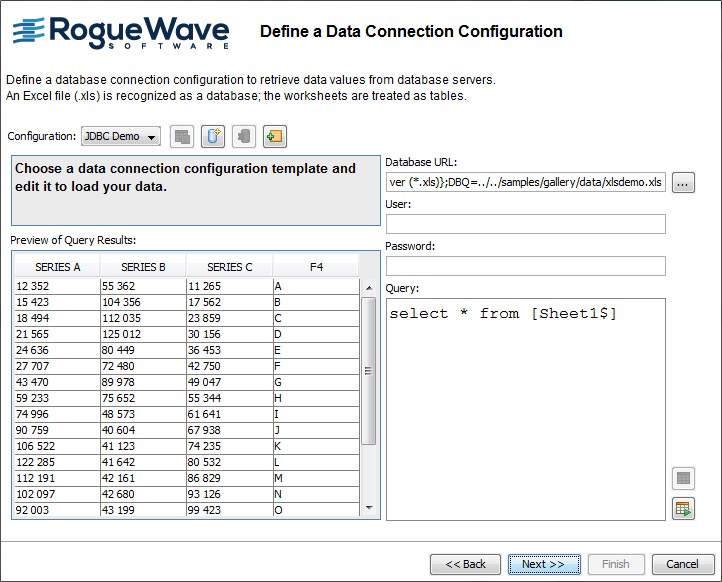
Defining a data connection configuration
The first page allows you to define the database data source.
1. You must specify the following:
A URL to connect to the database.
Your user name and password, if these security items are required.
The SQL query string.
URL
The Universal Resource Locator (URL) can indicate a connection to a remote database or a path to a local file. In this example, the database is an Excel file named xlsdemo.xls.
User Name and Password
If your data is in a local file, you will not need to enter a user name and password. If your data is in a database, the Database Administrator can provide the information.
SQL Query
You must enter a query to retrieve the data from the database. Initially, a default query is shown; this query selects all columns from a sheet, as follows:
SELECT * FROM [Sheet1$]
2. Modify the query to retrieve data from Sheet2.
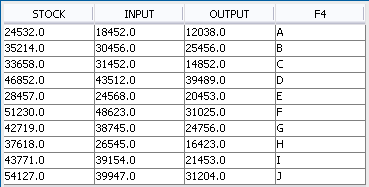
In the Query field, replace Sheet1 by Sheet2 and click the Execute Query button. You will see the data in tabular form in the Preview pane.
Check that the data retrieved is the required one and click Next to continue.
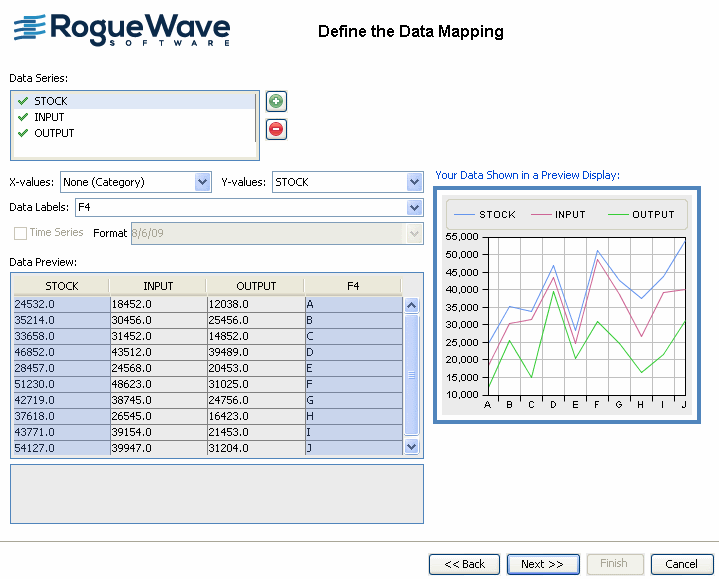
Defining the data mapping
This page allows you to specify the mapping of the database columns to graphic properties.
The data mapping defines which columns of the query results should be used for the display of the chart and in which role. The data mapping is an association between the columns of the query results and a list of data series. Each data series is composed of the following elements:
a column of Y values (mandatory)
a column of X values (optional)
a column of data labels (optional)
The order of the data series is important: data series are drawn in the same order, so that the last data series appears on top of the others.
To create a new series you have to click the
button, rename the data series newly created and choose the query results column(s) to which it corresponds. For the X and Y values of a data series you can only choose a numerical column; for the labels you can use a non-numerical column.
The data mapping is complete when all the columns containing the data that you want to view are mapped to data series.
In this example you can leave the default mapping.
Click Next to continue.
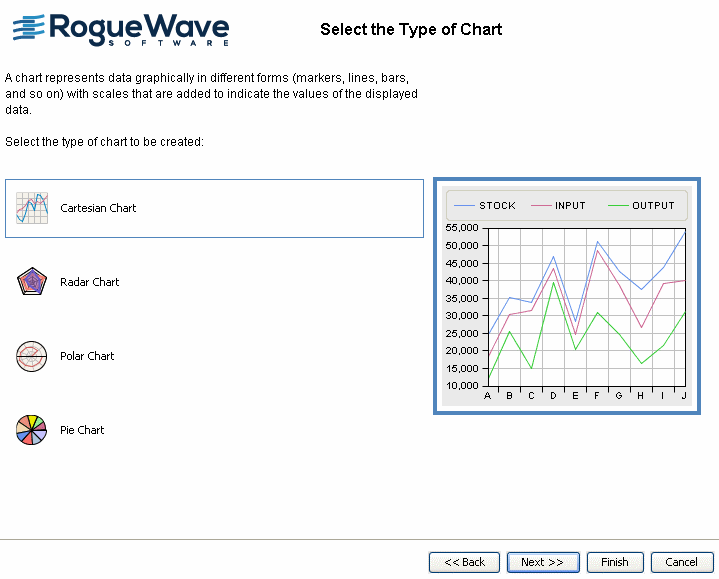
Selecting the type of chart
1. Create a Cartesian chart.
2. Select the option Create a Cartesian chart and click Next.
3. From the Representation Family list, select the option Bar.
4. Select the option Clustered and click Next.
Choosing a theme
For this example, you can leave the Default theme.
Click
Finish to end your wizard session.
If you need to make changes, click Back to return to specific wizard pages.
The resulting chart should appear in the Designer, as follows:
Loading data from memory
Data points are stored in memory with arrays of double primitives. This type of data source supports writing operations such as appending a new data point or changing values of an existing data point. For more information on the in-memory data source, see
Populating the chart in
Introducing JViews Charts.
Loading data from memory
1. Click File > New from Wizard.
2. Click Start From Basic Elements and Next
3. Select User-Defined Data Model and click Next. The window shown in the following section is displayed.
Editing your data model
You are going to edit the data model by removing the column “Y2”.
1. Select the column Y2 by clicking one of its cells and then click the Remove Column button.
2. Click Next to continue.
Define the data mapping
In this example, you can leave the default data mapping.
Click Next to continue.
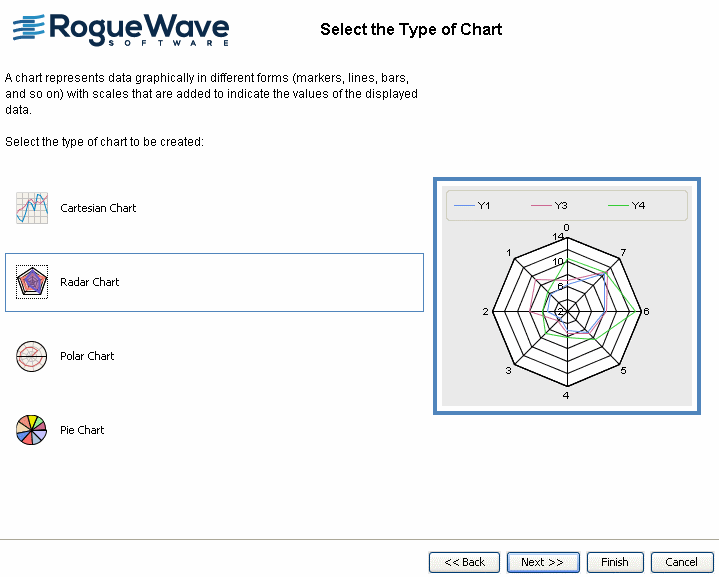
Selecting the type of chart
1. Select the option Create a radar chart and click Next to continue.
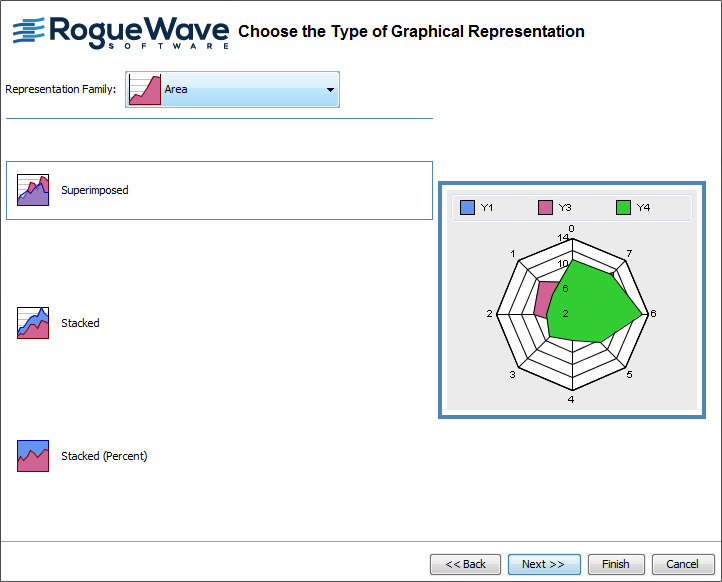
2. From the Representation Family list select the option Area.
3. Select Superimposed and click Next.
Choosing a theme
1. For this example, you can leave the default theme.
2. Click Finish to end your wizard session.
If you need to make changes, you can click Back to return to specific wizard pages.
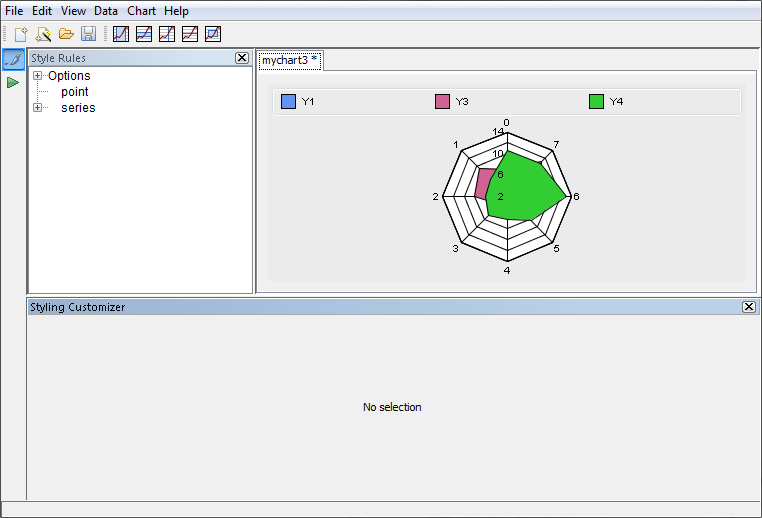
The resulting chart should appear in the Designer, as follows:
Copyright © 2018, Rogue Wave Software, Inc. All Rights Reserved.