Typical uses of charts
You can use Rogue Wave® JViews Charts to report data to communicate their values and trends, for example.

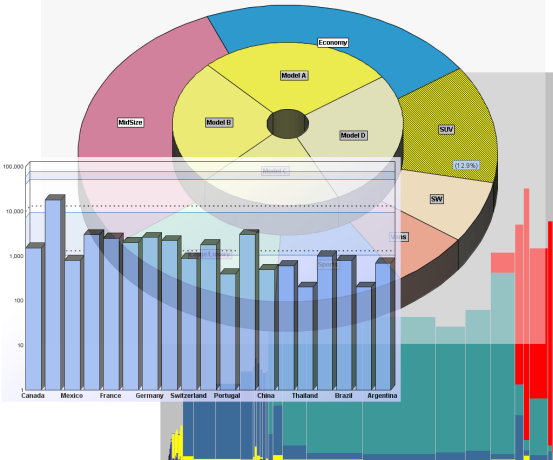
Applications that need to report data to communicate their values and trends. The audience can be large (for instance NASDAQ evolution displayed in a search-engine portal), or it can be restricted to some employees of a company (financial dashboard dedicated to the top level management, application performance dashboards for MIS, Web dashboards for web team). These applications use classical charts that do not require any training (bar graphs, pie charts). These charts are read-only and often published on the web (thin client), and these applications are used occasionally.
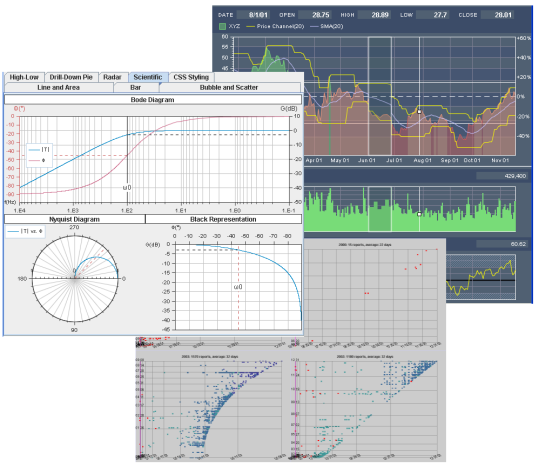
Mission-critical applications that are used by professionals to perform their daily job. These charts are often changed in real time, that is, they are connected to the data stream and updated in real time. These charts are customized for the application need and require precise strategies for scrolling, zooming-in, spotting data of interest, interacting and editing data. Such applications exist in all industries: applications for traders, test beds for engines (cars, airplanes, and so on) and other machines, network or application management, scientific research.
You can find more examples of charts in the
samples page.
Copyright © 2018, Rogue Wave Software, Inc. All Rights Reserved.