The diagram component
Describes the basic functions of the diagram component.

Provides an overview of the diagram component, a panel containing graphic objects that represent your business objects. The diagram component is organized as a graph of nodes and links, and is a JavaBean™ for easy insertion into a graphic editor or monitoring application.
Explains the
IlvDiagrammer class and its component classes.
Provides an overview of the two different types of data source: XML data source and JDBC data source.
Explains the style sheet, a
.css file that defines the way the objects of your data model will be translated to graphic objects.
Describes a project, which is the association of a style sheet with the data source that supplies it data.
Describes the different methods of interacting with the diagram, controlling the view, laying out the objects, and editing or printing it.
What is a diagram component
The diagram component is a panel containing graphic objects that represent your business objects, organized as a graph of nodes and links. It is a JavaBean™ for easy insertion into a graphic editor or monitoring application.
The diagram component is designed to provide all the basic functionality that most applications will need to display and edit diagrams. Its basic functions are described in this section. Some applications, however, will need to extend the basic functionality, or to use advanced functionality not directly accessible in the diagram component. These advanced features are described in the later sections.
The Diagrammer class
The diagram component is represented by the
IlvDiagrammer class, which is in the main Rogue Wave® JViews Diagrammer package,
ilog.views.diagrammer, see figure
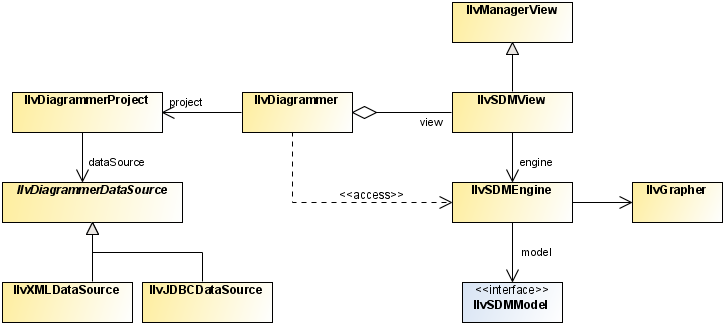
The IlvDiagrammer class relationships.
The diagram component
The
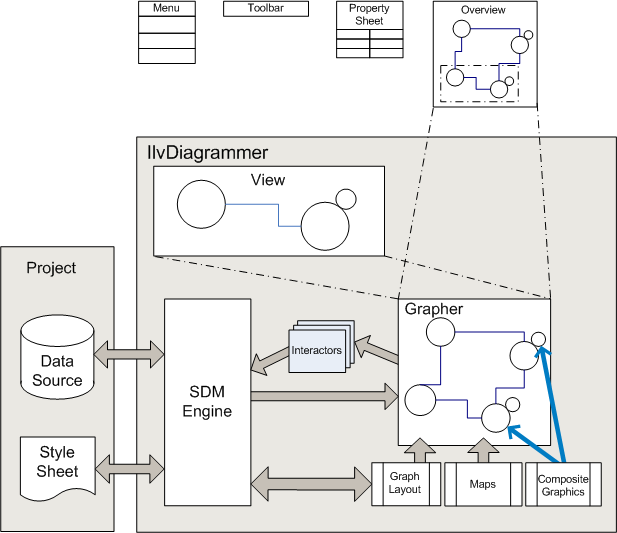
IlvDiagrammer class is a façade that gives easy access to the following underlying facilities:
The SDM (Stylable Data Mapper) engine in the package
ilog.views.sdm, which transforms your application data into graphic objects on your screen, based on styling information contained in one or more style sheets.
A project, which gives access to the first style sheet and the data source for loading your data.
A grapher, which is a low-level object whose role is to manage the nodes and the links and arrange them as a graph.
An SDM View (also in the SDM package), which displays the resulting diagram on the screen.
The Composite Graphics package
ilog.views.graphic.composite, which lets you define complex graphic objects from basic elements like shapes, text, and icons.
The Application package
ilog.views.diagrammer.application, which contains Swing objects such as actions and toolbars that make it very easy to build a complete Swing GUI around a diagram component. A prebuilt application is also available in the Application package.
The IlvDiagrammer class relationships
The data source
The role of the data source is to load the data to display in the diagram, and possibly write back the data if it has been modified.
There are the following predefined types of data source: XML data sources, which read data from an XML file and JDBC data sources, which read data from a database through the JDBC API.
The data source is represented by one of the following classes in the package
ilog.views.diagrammer.datasource:
These classes are subclasses of
IlvDiagrammerDataSource IlvDiagrammerDataSource.
An XML file ( IlvXMLDataSource ) can be in the required format, which is called diagram format, or in a custom format, in which case XSLT files must be supplied for reading and writing.
A database ( IlvJDBCDataSource ) must be JDBC-compliant. SQL is used to read and write data.
Extra types of data source can be defined to read data from other sources.
To set the data source of a diagram component, you can use the
setDataSource method. The following code example shows how to use this method.
Setting an XML data source for the diagram component
IlvXMLDataSource dataSource = new IlvXMLDataSource();
dataSource.setDataURL(new URL("file:example.xml"));
diagrammer.setDataSource(dataSource);
Alternatively, you can set the data source and the style sheet at the same time by loading a project file (see
The project).
The style sheets
A style sheet is a .css file. It is referenced by a URL. The style sheet can load other style sheets using the import statement. A style sheet controls the mapping of data to a graphic representation through style rules conforming to the CSS level 2 syntax. It defines the way the objects of your data model will be translated to graphic objects.
The SDM engine accepts
cascading style sheets (
CSS). Cascading style sheets can be used to define several levels of customization. For example, different style sheets could be defined for a whole company, a group, and an individual user.
You can either write a
style sheet by hand or create it using the Rogue Wave JViews Diagrammer Designer. For example, if your final application loads a custom data model, you can still use the Designer to define the style of your diagram. All you need to do is to create a sample XML file containing objects with the same properties as your real data. Then, use the Designer to define the graphic style of your nodes and links. When you save your project, the Designer will create three files: a project file (
.idpr ), an XML file containing your sample data (
.xml ), and a CSS file containing all the styling information (
.css ). In your final application, you will only use the CSS file as explained next, and load your real data instead of the sample data used in the Designer.
Style sheets are usually suitable only for a particular data model. For example, if your data model describes a workflow process, it will contain such objects as activities, transitions between activities, and participants that carry on the activities. A style sheet for such a data model will have rules that match these particular object types and their properties to define the graphic look of the objects. So, a workflow style sheet will probably not work for another data model, because the objects will not have the same types and properties.
To assign a style sheet to the diagram component in Java™, call the method
setStyleSheet. This method takes an array of
String with each element representing one style sheet. The array simulates the cascading of style sheets, where the last style sheets have a higher priority than the previous ones. The following code example shows an example with only one style sheet.
Setting the style sheet of a diagram component
String[] styleSheet = new String[] { "file:example.css" };
engine.setStyleSheets(styleSheet);
Alternatively, you can set the data source and the style sheet at the same time by loading a project file (see
The project).
Style sheets can be cascaded, that is, concatenated with later style sheets having a higher priority than earlier ones. To cascade style sheets, use the
addStyleSheet method, see the following code example.
Adding a cascaded style sheet to a diagram component
Diagrammer.addStyleSheet(new URL("file:cascaded.css"));
For details of the syntax of the style sheet and how to use it to customize nodes and links, see
Using CSS syntax in the style sheet.
As well as the diagram component itself, you can customize its associated Swing user interface components through the style sheet. See
User interface components for more details.
The project
The
project is an association of a
style sheet and a data source which supplies data. It groups the inputs for a diagram. A project is saved as an XML file with the extension
.idpr (Diagrammer Project File).
Loading a project file is the recommended way to load a diagram in Java™ because it is the quickest way. The following code example shows how to load a project into a diagram component using the method
setProject.
Loading a project file into a diagram component
IlvDiagrammer diagrammer = new IlvDiagrammer();
diagrammer.setProject(new IlvDiagrammerProject(
new URL("file:myproject.idpr")), true);
//display the diagram
The project is represented by the
IlvDiagrammerProject class, which is in the Rogue Wave® JViews Diagrammer package
ilog.views.diagrammer.project. When a new project is created, the style sheet and data source are both
null.
The following code example shows how to create a new project file, set the style sheet and data source, and save the file.
Creating a project file
IlvDiagrammerProject project = new IlvDiagrammerProject();
project.setStyleSheet(new URL("file:example.css"));
IlvXMLDataSource dataSource = new IlvXMLDataSource();
DataSource.setDataURL(new URL("file:example.xml"));
project.setDataSource(dataSource);
project.write(new URL("file:example.idpr"));
Managing the diagram
You can interact with the diagram, control the view, edit the diagram, apply a layout to the objects, print the diagram by using the appropriate methods as described below.
Interacting with the diagram
The following methods determine which interactions are available to users of the diagram component, that is, what happens when a user clicks:
setPanMode: the view can be moved in any direction
Controlling the view
For scrolling, you can use the
setScrollable method to control the visibility of the diagram scroll bars.
For zooming, you can use the following methods:
The
resetZoom method to reset the zoom factor to 1:1.
Editing the diagram
The
IlvDiagrammer class provides full support for editing, that is, you have all the methods necessary to create an editor based on the diagram component.:
For editing objects, the
cut,
copy,
paste,
delete,
duplicate,
addObject,
removeObject,
group,
ungroup, methods and others let you edit the nodes and links.
Printing the diagram
The methods
print,
printToBitmap,
pageSetup,
printPreview,
setPrintArea let you print all or part of the diagram.
Advanced methods
The methods of the
IlvDiagrammer class let you achieve the most common tasks, but you will often need to extend the diagram component, or access advanced functionality not available directly in the
IlvDiagrammer class.
For this reason, methods such as
getEngine,
getView,
getSelectInteractor,
getPrintingController give you access to the low-level objects that implement advanced features.
Copyright © 2018, Rogue Wave Software, Inc. All Rights Reserved.