Types of displays covered by JViews Diagrammer
Describes the three types of displays JViews Diagrammer allows you to create, depending on the type of data to represent.

Presents the use cases for diagrams.
Presents the use cases for dashboards.
Presents the use cases for map displays.
Diagrams
Diagrams are used to show the relationships between entities in a system. The entities are called nodes and the relationships are called links. This type of display helps model and manage a business system’s entities connected either physically (like in a communications network) or logically (like in a process flowchart).
JViews Diagrammer can be used to build computerized displays of static as well as dynamic diagrams. A diagram can be static in the sense that there are no changes in its appearance while it is displayed: it is a snapshot of a given system. Typical examples include flowcharts and organization charts.
A dynamic diagram can react to user actions or external data feeds, or both. It remains in contact with business data during the display phase and is expected to change over time in response to business-related changes. Typical examples include process flow diagrams and network monitoring diagrams.
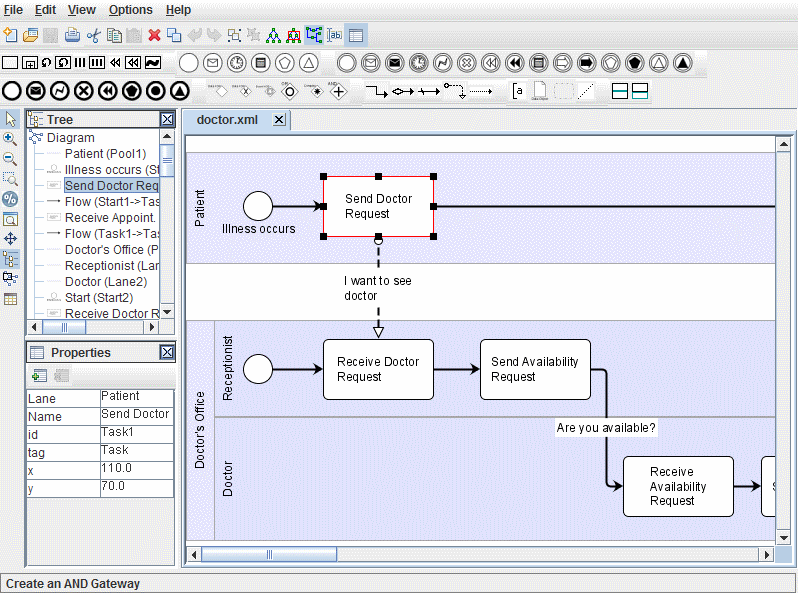
As diagrams grow larger and more complex, JViews Diagrammer allows you to make them more readable through its built-in graph layout algorithms, organizational techniques such as subgraphs and swimlanes, helpful zooming and scrolling behavior, and even customized interactions such as editing, drill-down, and more.
A workflow diagram
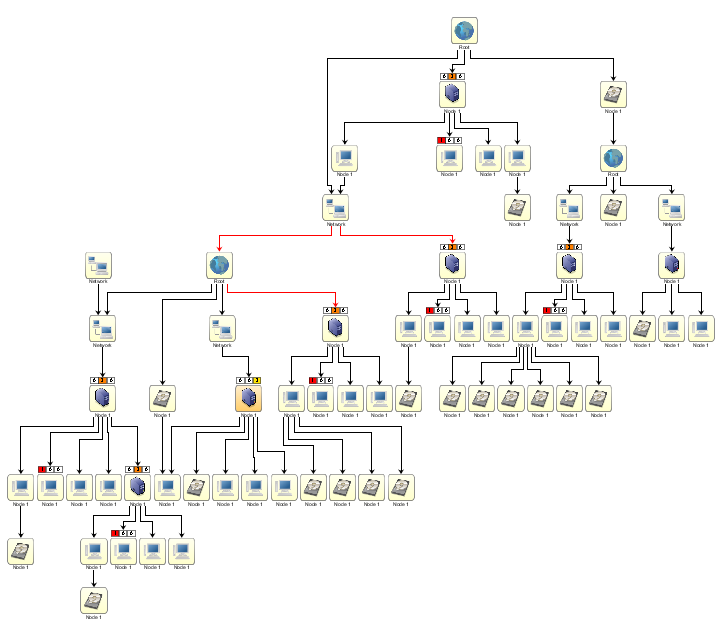
A topology diagram
Dashboards
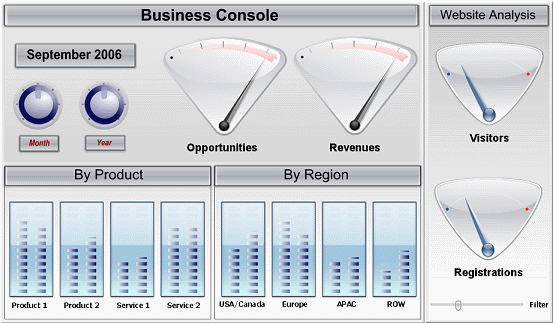
Dashboards are used for monitoring business or industrial systems. They help operational people oversee the KPIs (Key Performance Indicators) of business processes. In the industrial field, dashboards are used for schematics, process control or SCADA (Supervisory Control And Data Acquisition) applications to show the current status of physical equipment. The data to be monitored is graphically represented by gauges, dials, sliders, meters, and so on, that are manually placed by the user on the dashboard. A connection between the data repository and these graphic objects is required for the dashboard to visually and realistically translate measurements or the status of physical equipment.
A business activity monitoring dashboard
An industrial monitoring dashboard
Map-based displays
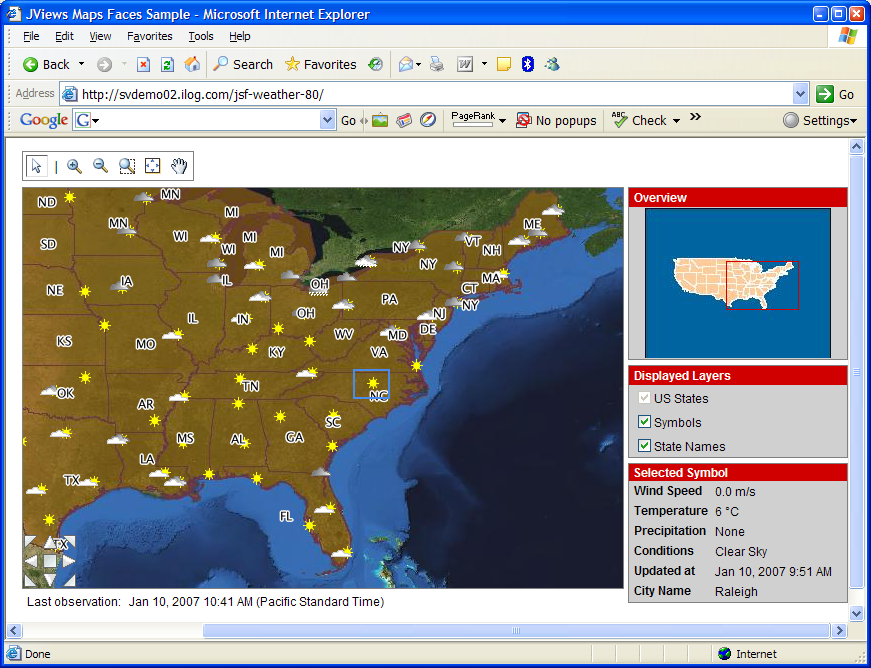
Map-based displays are used to represent and manage georeferenced assets in applications such as logistics, defense, traffic monitoring, or network systems. Objects are placed on top of a map according to their latitude and longitude coordinates; in a dynamic application, the geographic positions of the objects are updated as the values of the underlying data change.
Map-based displays are fully supported if the extra product Rogue Wave® JViews Maps is purchased and installed.
A weather map in a Web application
Copyright © 2018, Rogue Wave Software, Inc. All Rights Reserved.