Typical uses of JViews Maps
Gives examples of use of JViews Maps.

Describes the application fields of
JViews Maps.
Gives general tips for using
JViews Maps.
Describes typical actions when creating maps.
Overview
You can use JViews Maps for:
Network management systems
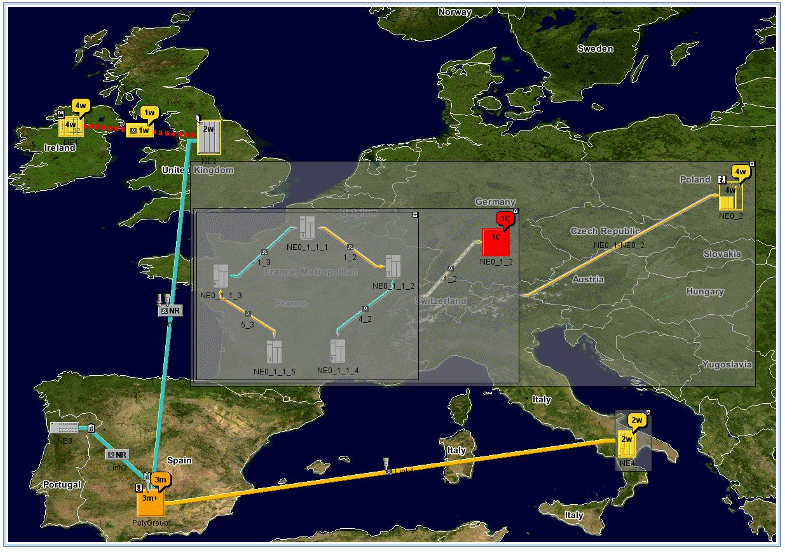
The network elements are georeferenced and displayed on digital maps. JViews Maps manages the type of map to be displayed and displays meaningful data at each zoom level. Overviews display high level networks (summaries) with continent or country maps underneath. Network operators can drill down into more detailed views: they zoom in on a specific region or even on a city, where they can see the network details. In these cases, JViews Maps loads more precise maps that are more convenient for city-level views.
The following figure shows an example of part of a network.
Network management system example
Supply Chain Management, Transportation
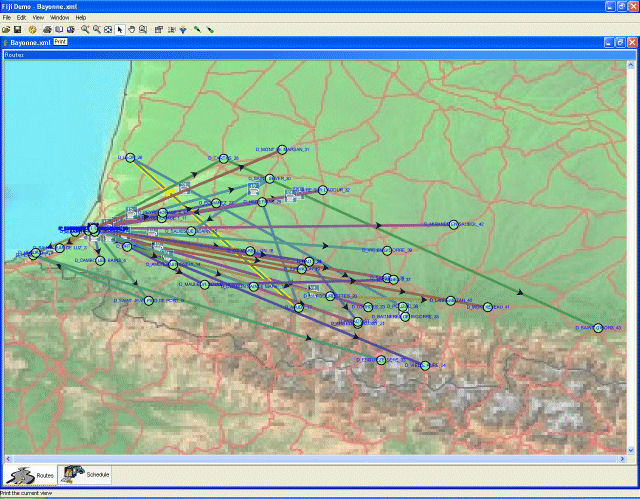
Company assets such as trucks, warehouses, and customer sites are displayed on maps to make the supply chain more readily appreciated. Warehouses can be displayed as symbols upon maps and routes can be displayed as links or as precise road-routes.
The following figure shows an example of part of a network.
Supply Chain Management transportation example
General use
JViews Maps can manage accurate map data and projections for asset mapping applications. Such applications need to combine map data coming from various sources to display the operations.
JViews Maps has the flexibility and high performance necessary for fast response time. Typically, you would want to read in the map data, create a map
theme and then place and animate symbols on the background map. You can use your own predefined theme and apply it to different sets of data.
In the Map Builder, you can read the data and apply the theme in an easy-to-use point-and-click editor. You can also save your map application, making the configuration settings persistent. Data and theme can be saved separately.
Typical actions
Reading the Data
You import different data sources into a map to provide different views of the data contained in the map. Each data source is associated with a different map layer.
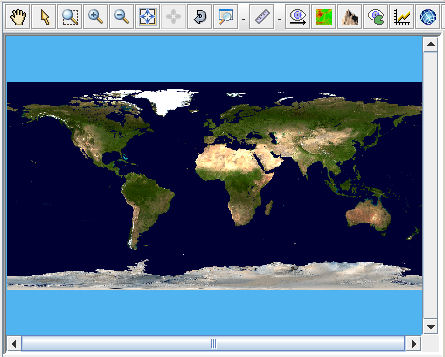
For example, you might start with a shape file, to provide an uncomplicated view of the world as a backdrop.
World map in an application
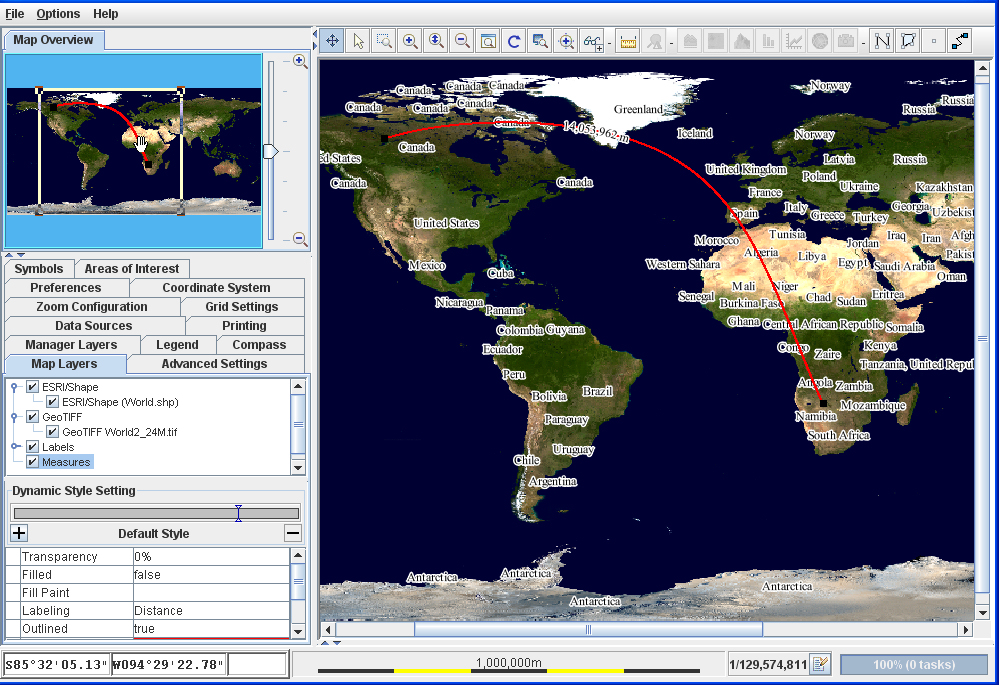
Then you could refine the esthetic representation of the map by importing a
GeoTIFF format map of the world.
World map in GeoTIFF format
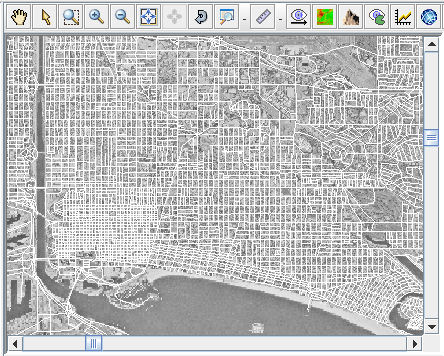
Street level views can be added from
GeoTIFF format and ESRI/
Shapefile format data sources.
Street data in Los Angeles from an ESRI/Shape data source
An example of the series of typical data source types outlined here can be found in
An example map in
Using the Map Builder.
That particular example is based on North America and Los Angeles in particular, but you could equally well import your own data sources for other parts of the world.
JViews Maps is supplied with the Map Data disk, which includes general map formats that can be distributed free.
Themes and styling
For each map layer you can decide its look and feel in terms of its color, thickness transparency, and so on, and you can define settings for specific zoom levels so that the look and feel changes when users zoom in and out. The look and feel of each layer and its zoom triggers represent a map theme. This is used to visualize only meaningful information for each context.
Placing symbols
Symbols can be created using the Symbol Editor and added to maps using the Designer for JViews Diagrammer.
You can then load the Designer project file that contains the background map developed with the Map Builder and the Symbols added with the Designer, and load it into your application. For more information about symbols, see the JViews Diagrammer document Developing with design tools>Using the Symbol Editor.
The Tools for the job
Rogue Wave® provides a sample application, the Map Builder, that includes the data reading and writing facilities and the layer styling facilities for building
theme in a point-and-click editor. The sample code is accessible and you can easily customize it.
The product also includes the Designer for JViews Diagrammer. The Designer is a point-and-click editor used for writing style rules that control the styling of nodes on the map.
You can switch easily between these tools to hone your application. Typically, you use the Map Builder to speed up application development time by reading in the data sources in different formats and then creating the map theme by styling the layers. Then you would switch to the Designer to write style rules to change the appearance of nodes depending on certain conditions and to design symbols to represent nodes on the map.
If you need more than these easy-to-use GUIs have to offer, there is a full-featured SDK for refining and customizing your application. In addition to the general mapping API of JViews Maps, you have access to the Styling and Data Mapping (SDM) package of the JViews Diagrammer API for the styling of nodes to place on a background map, and the whole of the JViews Framework API with its powerful graphics framework. You have full control over what you do.
Key Strengths of JViews Maps
In the application, the up-to-date data can be displayed against the background map with the appropriate symbols correctly positioned.
The key strengths of JViews Maps make it ideal for asset-mapping applications.
Components, such as beans, readers, map displays, and map views, are easily customizable to adapt to your needs. Your existing system architecture can be maintained.
Performance allows for almost instantaneous zooming in and out and the system can manage huge amounts of data.
Animated symbols can show the movement of resources on the map.
Since the map data and the map theme can be saved separately, the map theme can be used to style maps for different regions so that they have the same color scheme and visual properties. The final user can then reuse this theme and apply it to the appropriate data source at run time.
Map applications built with JViews Maps can be an essential part of a decision support center whether on or offline.
Copyright © 2018, Rogue Wave Software, Inc. All Rights Reserved.