Loading user-defined data
Describes the tasks necessary to load data from user-defined data.

Explains the steps necessary to load data from user-defined data.
Explains how to load data from the New Gantt Chart Wizard.
Describes how to map the properties of activities in the Gantt user-defined data model to the properties in the Activities Table of the data source.
Overview
It can be useful to copy data from a data source, for example, a Microsoft® Excel file, and paste it into the tables in memory for quick prototyping of a Gantt chart. If you choose this route, you do not need to understand SQL queries or database connections; you just need the data to be in some kind of row-and-column format with separators between the items in a row and a carriage return character at the end of the row. You can then map the properties of the Gantt user-defined data model to the columns in the normal way.
The use case is based on data from the Microsoft® Excel file harbor.db.
In this section you will:
Create a chart from basic elements.
Choose a user-defined data source.
Paste the data from
harbor.db into the Activities Table.
Add a column for the parent ID to make it possible to structure the model in a hierarchy and to map the data.
Map the columns in the data source to graphic properties of activities.
Create new properties and map them to the appropriate columns.
The mapped properties can be used for styling your data by creating style rules that refer to the properties.
Accessing the data
Load the data from the New Gantt Chart Wizard.
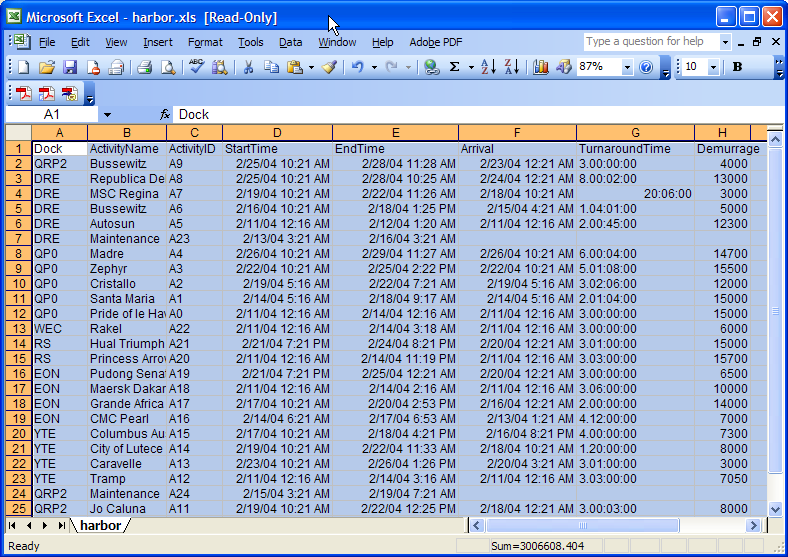
1. In Microsoft® Excel, open the file harbor.db that contains the data you want to load into memory.
This file is located in:
<installdir>/jviews-gantt/bin/designer/data/examples
2. Start the New Gantt Chart Wizard, for example, by choosing File > New From Wizard.
3. Select Start From Basic Elements and click Next.
4. Select User-Defined Data Model as data source type and click Next.
The properties of activities in the default data model are displayed. The default data model also includes properties for resources, constraints, and reservations. Depending on the data you want to load into memory, you need to adapt one or more of these sets of properties. Click the corresponding tab to access the properties of each object in the default data model.
5. Select and copy all the filled rows and columns in the file harbor.db.
The following figure shows the content of harbor.db being copied.
6. 
7. Select the Activities tab and click Paste from Clipboard to paste the content of the file harbor.db into the Activities Table.
8. Click OK to confirm that you want to keep the first row of the copied data as the column headers.
The following figure shows the resulting data model for the data in harbor.db.
9. 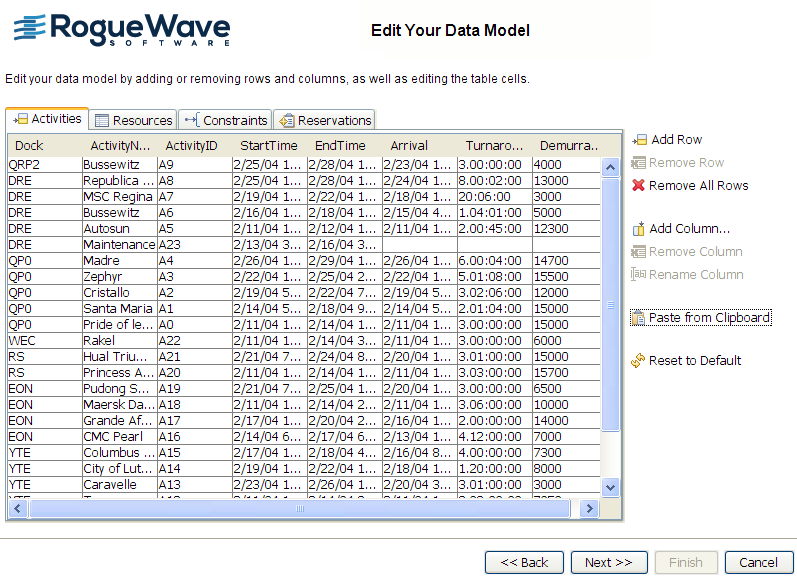
10. Click Add Column, type the name ParentID, and click OK.
Activities in the Gantt data model are structured in a hierarchy of parent nodes and leaf nodes. The parentID property also groups sibling activities under the same parent. In this example, there is no single root activity defined in the tabular data that groups all of the other activities. Therefore, you can leave the parentID column empty.
11. Remove all the rows from the Resources, Constraints, and Reservations tables.
You are only going to test your Gantt chart with activity data, and you should therefore remove the rows from the other tables. If you do not do this, the sample data in these tables will conflict with the activity data that you copied from the Microsoft® Excel worksheet. These data conflicts will prevent you from proceeding with the mapping of the data model properties.
For example, click the Resources tab and then click Remove All Rows. Repeat for all the rows in each of the Resources, Constraints, and Reservations tables.
12. Click Next to map the data.
Mapping the data
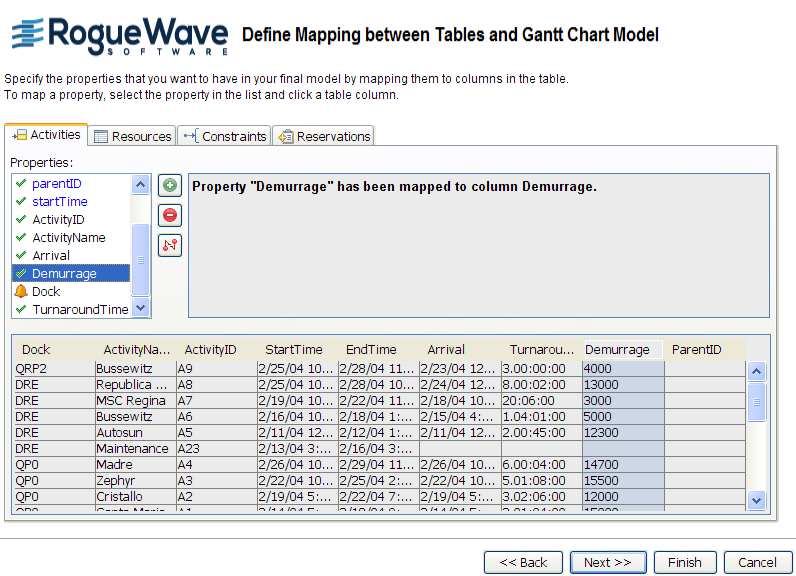
You need to map the properties of activities in the Gantt user-defined data model to the properties in the Activities Table of the data source. Properties that are unmapped and mandatory are shown with a red exclamation mark.
See
Mapping the predefined properties for how to map the predefined properties
id and
name to the corresponding columns in the Activities Table.
The user-defined propertiesArrival, TurnaroundTime, and Demurrage have been automatically created and mapped to the corresponding columns in the Activities Table.
Do not map to the column headed Dock. The content of this column refers to resources. The objective is to test your Gantt chart with activity data, so you do not need this column.
Select the
Dock property and click the clear mapping sign to remove the mapping
.
The following figure shows the result of the data mapping.
Click Next to choose the activity-oriented Gantt chart and then choose a theme. Click Finish to view the user-defined data in a basic Gantt chart.
Copyright © 2018, Rogue Wave Software, Inc. All Rights Reserved.