Importing data from a database
Explains how to load data from a database and map it.

Explains how to import the JDBC database.
Explains how to configure the connection to the JDBC database.
Explains how to associate the data with properties.
Explains how to edit the database data model.
Explains how to select a diagram type in the New Diagram wizard.
Explains how to specify a graph layout.
Loading the database
The JDBC data source allows you to import data from any database supported by Java DataBase Connectivity.
To import data from a JDBC database:
1. Click File > New from Wizard.
2. Click Next.
3. Select the database option.
See the following figure.
4. 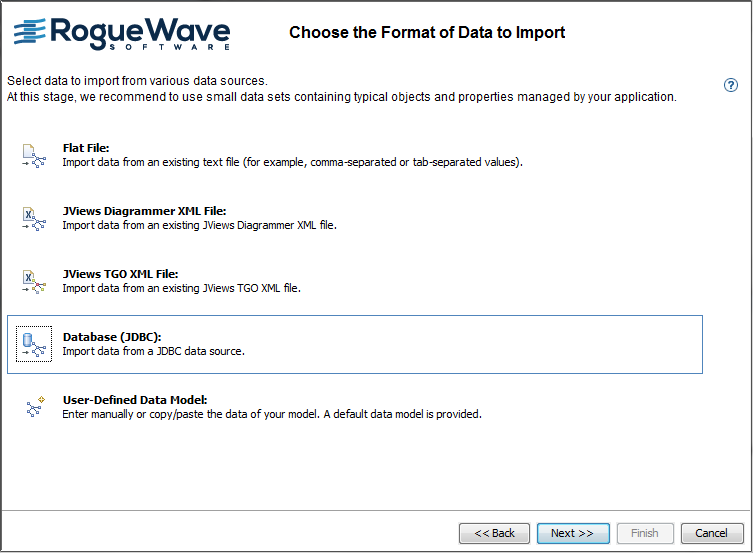
5. Click Next to move to the Import Data from a JDBC Data Source page.
Connecting to the database
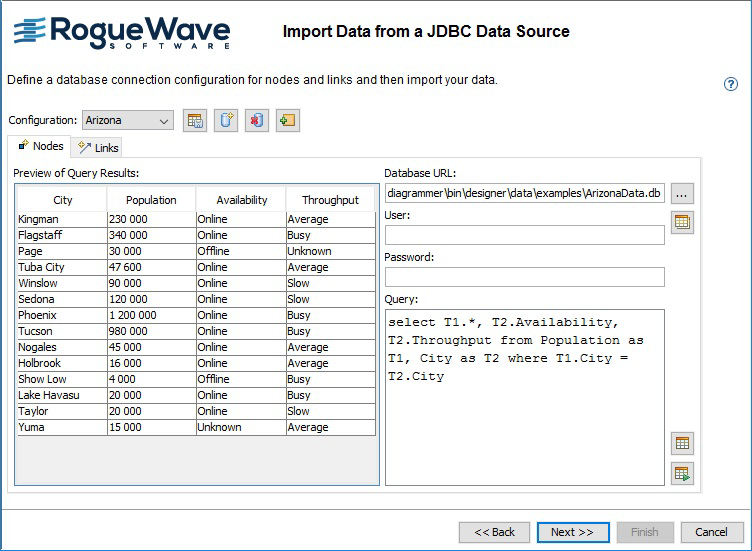
The Import Data from a JDBC Data Source page allows you to define a database connection configuration for nodes and links and then load your data.
This section uses the Arizona example.
To create a database connection configuration:
1. Click New Configuration to name a new database connection configuration.
2. Name it Arizona.
3. Specify a URL to connect to the database.
The Universal Resource Locator (URL) can indicate a connection to a remote database or a path to a local file. It specifies the driver to use and the path to the file or database.
The default driver is SQLite JDBC®; this is correct for the Arizona data. The path is relative to the Designer run file location.
a. Click the Ellipsis button.
b. Browse to select the data file ArizonaData.db.
Note that the Designer replaces only the file name in the URL.
4. Specify your user name and password, if these security items are required.
If your data is in a local file (as the Arizona data is), you do not have to enter a user name and password. If your data is in a database, the Database Administrator can provide the information.
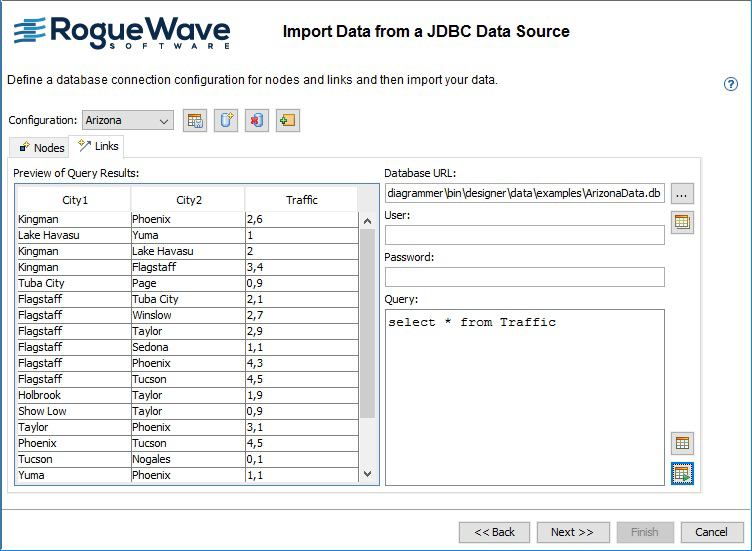
5. Specify an SQL query string for nodes (in the Nodes tab) and an SQL query string for links (in the Links tab).
In the example supplied as ArizonaData.db, suitable queries are as follows:
For node data:
select T1.*, T2.Availability, T2.Throughput from Population as T1, City as T2 where T1.City = T2.City
For link data:
select * from Traffic
6. Click Execute Query to execute the SQL query.
7. Click Save Configuration to store the database connection configuration for future use.
The database connection configuration is stored in the project file.
Note that the Rogue Wave® predefined connections cannot be saved. In the case of a predefined connection, the Save Configuration button is disabled.
After executing an SQL query, you see the data in tabular form in the Preview pane, see the following figure for node data.
Retrieving Arizona node data
8. Check that the data retrieved is as required.
See also the following figure for link data.
Retrieving Arizona link data
9. Click Next to proceed.
Mapping the database
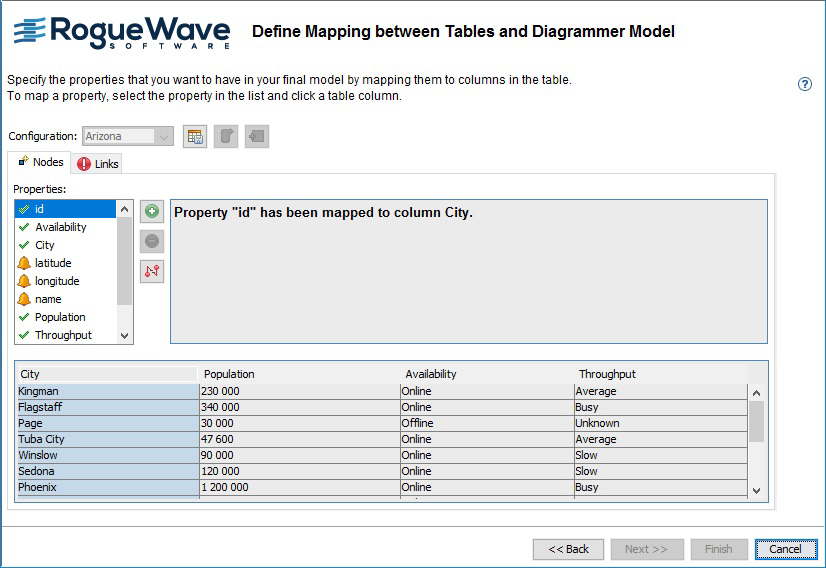
The Mapping page allows you to specify the mapping of the database columns to graphic properties for nodes and for links.
Only mapped properties will be part of the data model.
Properties that are mandatory must be mapped; if they are not mapped, you cannot move forward in the wizard.
Optional properties do not have to be mapped, but if they are not mapped, they will not be in the final data model.
Properties that are not mapped to node data and require to be mapped appear with the following status
in the list of properties, and the same status appears on the Nodes tab.
Optional properties that are not mapped to node data appear with status
in the list of properties.
To define the mapping for nodes:
In the Nodes tab, click the property
id, then click the column City.
After the id is mapped, the preview shows the nodes separately, see the following figure.
The mapping for nodes
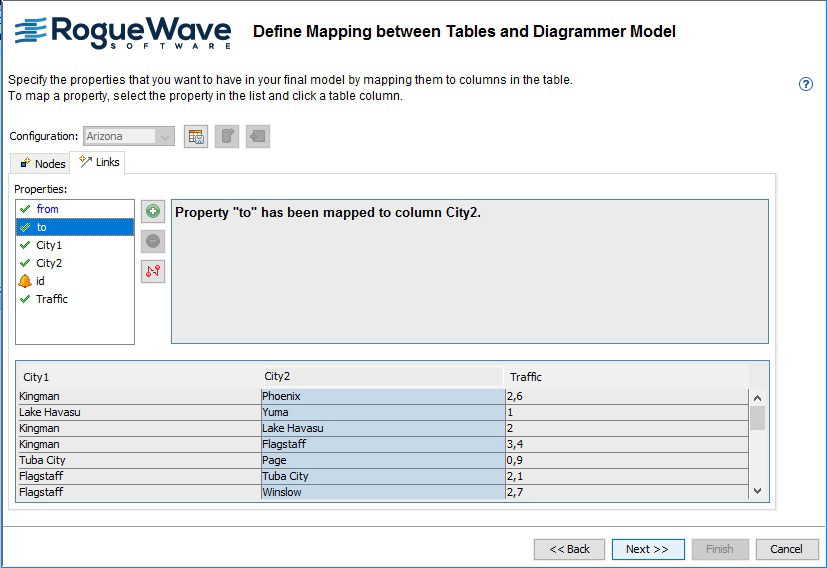
To define the mapping for links in the Links tab:
1. Click the property from, then click the column City1.
2. Click the property to, then click the column City2.
After the from and to nodes are mapped, the preview shows the nodes and links, see the following figure.
The mapping for links
Some commonly required properties are available in the list (such as x and y). If you need to, you can add further properties.
To map extra properties:
1. Click the
1. 
1. button to add a property.
2. With the new property selected, map it by selecting a column.
You can remove unwanted properties.
To remove the mapping of a property:
1. Select the property in the list.
2. Click the
3. 
4. button.
To remove a property:
1. Select the property in the list.
2. Click the
3. 
4. button.
When you have the correct mapping for both nodes and links and have saved it, click Next.
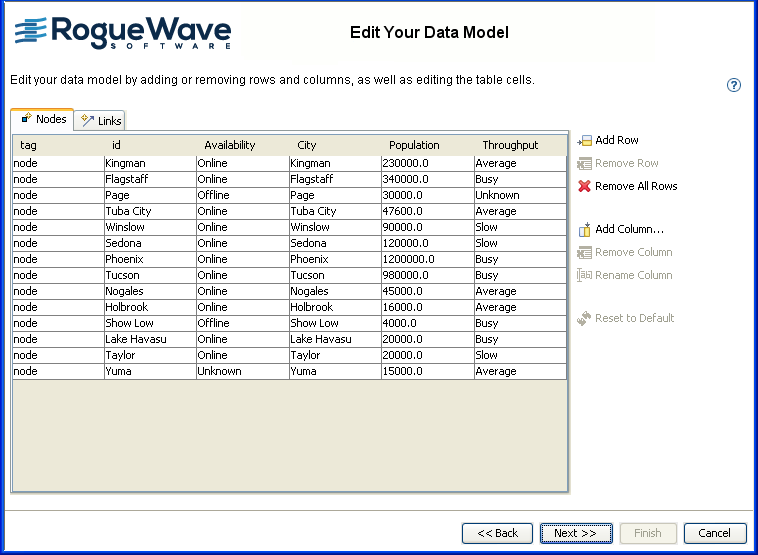
Editing the data model
You can edit the basic data model in a number of ways:
Add and remove rows (a row represents an object in the data model)
Add, remove, and rename columns (a column represents a property of the objects in the data model)
Change cell values (a cell represents a property of a specific object)
Remove all objects
Restore the data model to its initial state
To clear all the data values, click Remove All Rows. To retrieve the values you saw initially, click Reset to Default.
Properties id and tag are mandatory for the SDM model and therefore cannot be removed or renamed by the user.
Editing the database data model
You will keep this data model as it is.
To validate your data model:
Click
Next.
Selecting the diagram type
You must select a diagram type for the correct positioning of the nodes.
1. Select the Layout Diagram, see the following figure.
1. 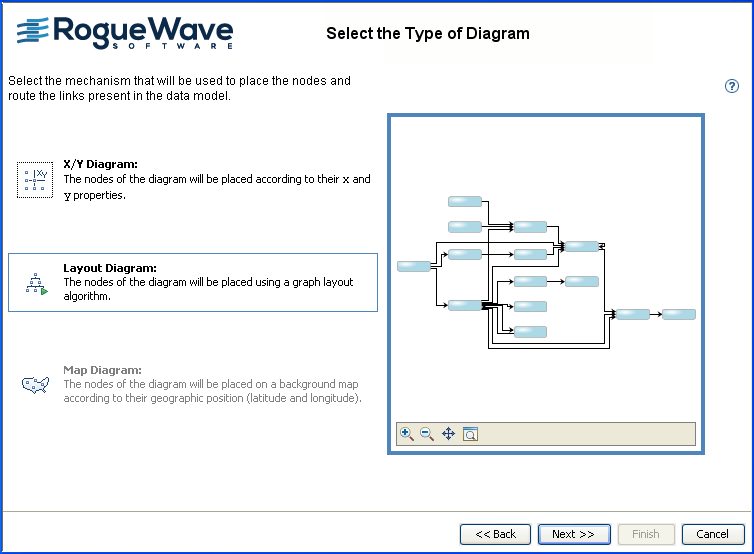
Specifying a layout diagram
NOTE You can create a Map Diagram only if you have purchased and installed the Rogue Wave® JViews Maps product. Otherwise, a warning message appears.
2. Click Next.
Choosing a Graph Layout Theme
The default layout is acceptable.
1. Click Next.
2. If you need to make changes, click Back to return to specific wizard pages.
3. When you have completed your wizard session successfully, click Finish.
The resulting diagram is as shown in the following figure.
4. 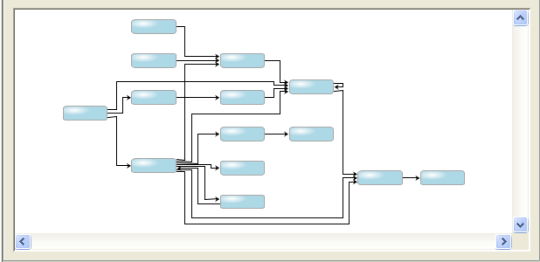
The initial Arizona Logical diagram
This diagram is available in
<installdir>/jviews-diagrammer/bin/designer/data/examples/ArizonaLogical.idpr. You can style it to show the Population, Availability, and Throughput data for nodes and the Traffic data for links in appropriate ways, see
Using data model expressions.
5. When the diagram is as you want it to be, click File > Save As and enter a new name.
Copyright © 2018, Rogue Wave Software, Inc. All Rights Reserved.