An example map
Guides you through creating an example map and saving it.

Describes data sources used in this example.
Explains how to create a new map and add different types of map data.
Explains how to set map properties to display map outlines or relief.
Explains how to enlarge a map area and add data to it.
Explains how to save the current map.
Explains how to zoom in to an area and add data to it.
Explains how to save the final map.
Overview
This section shows you how to create a map and save it as a file. This example map could be used in homeland security, for example, to deploy national guards in Los Angeles to counter an urban terrorist threat. The map goes down to street and building level.
The finished map consists of the following data sources:
Shape\World_Countries.shp Provides the world as a backdrop, although the actual sample is centered on California.
GeoTIFF\World2_24M.tif Adds an esthetically pleasing map, mainly for use in the Overview pane.
CADRG\A.TOC Provides important military information such as bases, topographic terrain information and corridors in the USA.
vmaplv0\noamer A pure vector type defense map covering North America.
GTOPO30-DEM\W140N40.DEM Provides altitude information for terrain analysis that can be performed later in the final application.
GeoTIFF\LA_Houses.tif Adds details of the houses in relation to the street level views.
Shape\LA_Streets.shp Provides a street level view of Los Angeles.
Creating a map
NOTE This section assumes that you have downloaded appropriate data to your workstation. For a list of suggested free sources for downloading map data, see
Map data To create the map containing the data sources described in
An example map:
2. Choose File>New Map to clear the Map View of any map data.
3. Choose File>Add Map Data to open the file browser, select the GeoTIFF format, and then select the drive where you have downloaded your data. For example, select the data source World2_24M.tif, and then choose Open.
NOTE You can copy all the files to your workstation for faster access.
4. Click the
5. 
6. button to fit the whole world into the view.
The following figure shows the resulting Map View pane.
7. 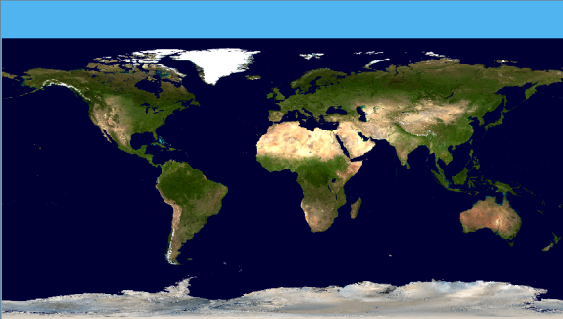
The data source World2_24M
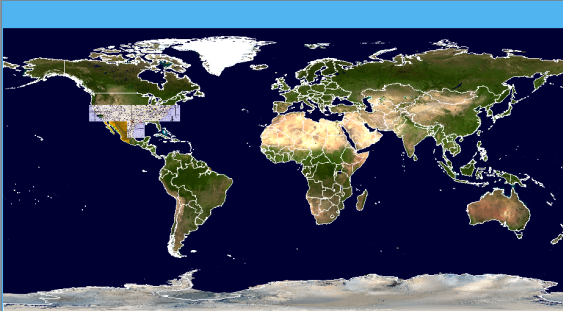
8. Choose File>Add Map Data to open the file browser, select the ESRI/Shape format, and then select the drive where you have downloaded and saved your data. For example, select the data source ESRI/Shape World_countries.shp, and then choose Open.
The following figure shows the resulting Map View pane.
9. 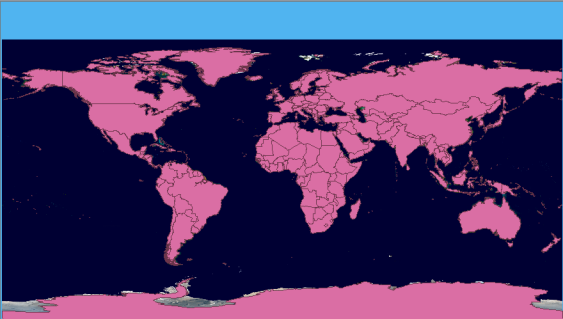
The data source World_countries.shp
Setting map properties
To set map properties:
1. Expand the ESRI/Shape branch and select the World_Countries.shp layer in the Map Layers pane to display the corresponding map style property sheet below it.
2. Scroll down the properties in the map style property sheet and select the Visible in Overview property and check that the value is False so that this data source is not displayed in the Overview pane.
3. Click in the right column of the Line Color property in the map style property sheet, click the
4. 
5. button, set the Line Color value to white using the Color Editor displayed and click Apply.
The following figure shows the resulting Map View pane.
6. 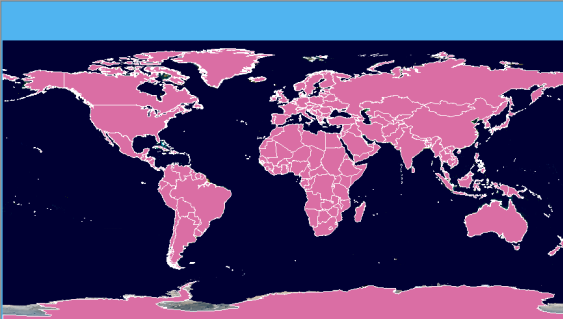
Setting the map outline color
7. Select the Filled property in the map style property sheet and set the value to False.
The following figure shows the resulting map relief.
8. 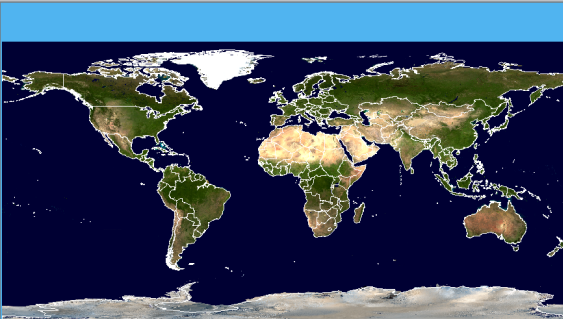
Setting the map relief
Adding data to a particular state
Zooming in on California
Click the
button on the toolbar and draw a rectangle around the California area to zoom in on it. If necessary, zoom in again to enlarge the map more.
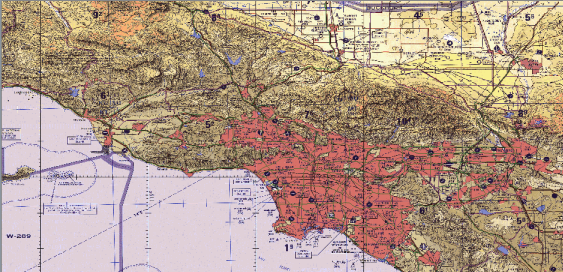
Adding military data
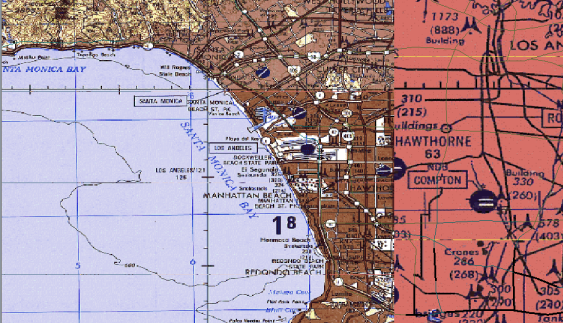
1. Choose File>Add Map Data to open the file browser, select the CADRG format, and then select the drive where you downloaded and saved your data. For example, select the data source A.TOC and then choose Open.
2. Click the
3. 
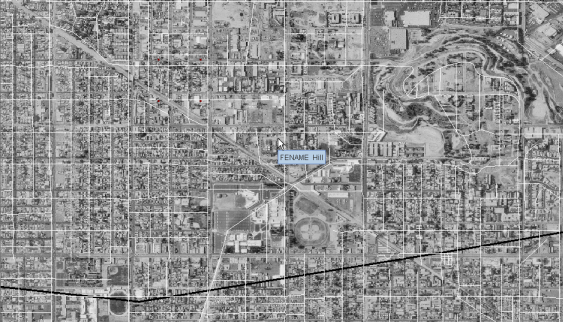
4. button on the toolbar and draw a rectangle around the Los Angeles area to zoom in on it. If necessary, zoom in again until the Los Angeles area fills the Map View.
The following figure shows the resulting Map View pane.
5. 
The data source CADRG A.TOC
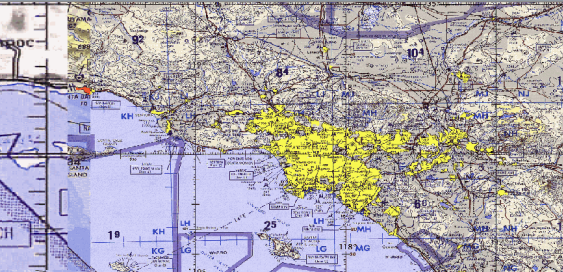
Adding vectorial VMAP data
1. ChooseFile>Add Map Data to open the file browser, select the VMAP format, and then select the drive where you downloaded and saved your data.
2. For example, select the data source noamer
3. Select Transportation (Roads) in the Features Choice pane, click the
4. 
5. button, and draw a rectangle around the part of the map where you want to add vectorial VMAP Data (Los Angeles). While you do this the Select Data Sources window remains open.
6. Choose Open.
The following figure shows the resulting Map View pane.
7. 
The data source VMAP noamer
8. In the Map Layers pane, open the VMAP hierarchy and select Road (secondary Route) to display the corresponding map style property sheet.
9. Select the Line Width property in the map style property sheet and set the Line Width value to 3.0.
10. Click in the right column of the Line Color property in the map style property sheet, click the
11. 12. button, and set the Line Color value to black using the Color Editor displayed.
The following figure shows the resulting Map View pane.
13. 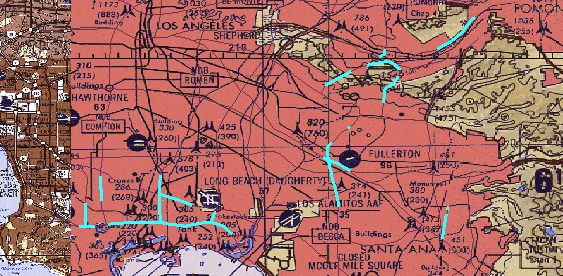
The data source VMAP noamer Road (secondary route)
Adding altitude information
1. Choose File>Add Map Data to open the file browser, select the GTOPO30-DEM format, and then select the drive where you downloaded and saved your data. For example, select the data source W140N40.DEM, and then choose Open.
The following figure shows the resulting Map View pane
1. 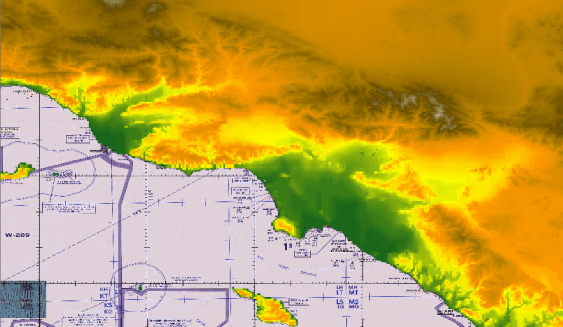
The data source GTOPO30-DEM W140N40-DEM
2. Select the GTOPO30-DEM layer in the Map Layers pane and drag and drop it just below the ESRI/Shape layer.
3. Select the Preferences tab and set the Distances property to International Statute Mile, the Altitudes property to International Foot, and the Coordinates property to UTM.
4. Select the Map Layers tab to redisplay the pane and then click the
5. 
6. button to display the whole map in the Map View pane.
The following figure shows the resulting Map View pane.
7. 
The data source GTOPO30-DEM W140N40-DEM
8. Select the VMAP layer in the Map Layers pane, click the
9. 
10. button to zoom to the content of this layer, and then zoom in on Los Angeles.
11. Select the Visible in Overview property in the map style property sheet and set the value to false to prevent this layer being displayed in the Overview pane.
12. Click the
13. 14. button again to display the whole map in the Map View pane.
Saving the current map
1. Save the current map ““look and feel””. The
theme can be saved without the data and applied to other imported data sources, or together with the map data. For more information about themes, refer to
Map themes and zoom levels.
2. Choose File>Save Map as in the main menu and select or deselect the Save Theme Only option as required.
NOTE The Save Theme Only option saves only a description of the map, without the data. As a result, saving will be quicker and take less disk space, but the theme may be unusable on another machine that does not have the original data source available.
Adding data to a particular city
Zooming in on LA
Click the
button, and zoom in twice on Los Angeles.
Adding LA house information
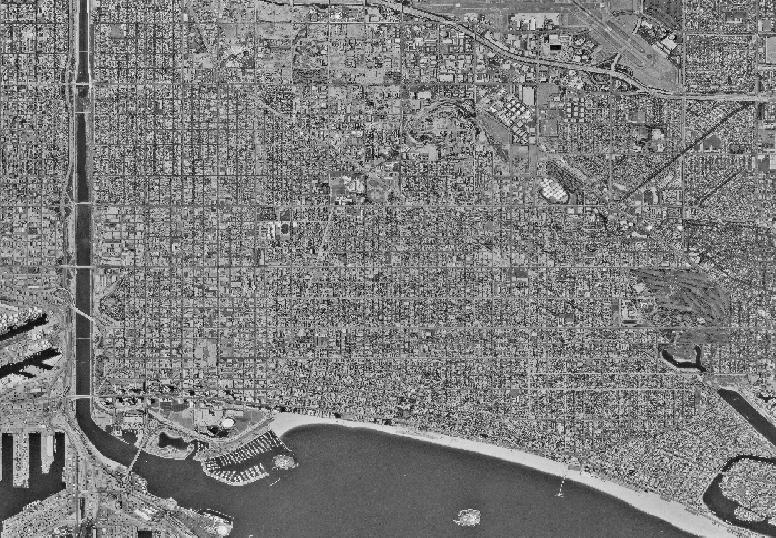
1. Choose File>Add Map Data to open the file browser, select the GeoTIFF format, and then select the drive where you downloaded and saved your data. For example, select the data source LA_Houses.tif, and then choose Open.
2. Click the
3. 4. button, and zoom in on Los Angeles.
The following figure shows the resulting Map View pane.
5. 
Los Angeles and its secondary routes
6. Drag and drop the GeoTIFF layer to the bottom of the Map Layers pane, open the hierarchy, and click the LA_Houses.tif data source to select it.
7. Click the
8. 9. button to zoom the whole LA_Houses.tif layer into the Map View pane.
10. Click the
11. 
12. button, and rotate the mouse wheel backwards to zoom into the part of LA_Houses.tif that is of interest. Now zoom in or out using the zoom in\out slider in the Overview pane, until the houses are displayed at the scale you want.
The following figure shows the resulting Map View pane.
13. 
The data source LA_Houses
Adding LA street information
1. Drag and drop the VMAP layer to the bottom of the Map Layers pane.
2. Choose File>Add Map Data to open the file browser, select the ESRI/Shape format, and then select the drive where you downloaded and saved your data. For example, select the data source LA_Streets.shp and then choose Open.
3. Drag and drop the ESRI/Shape layer to the bottom of the Map Layers pane and select LA_Streets.shp to display the corresponding Map Data Style Sheet.
4. Select the Line Color property and set the Line Color value to white using the Color Editor displayed.
The following figure shows the resulting Map View pane.
5. 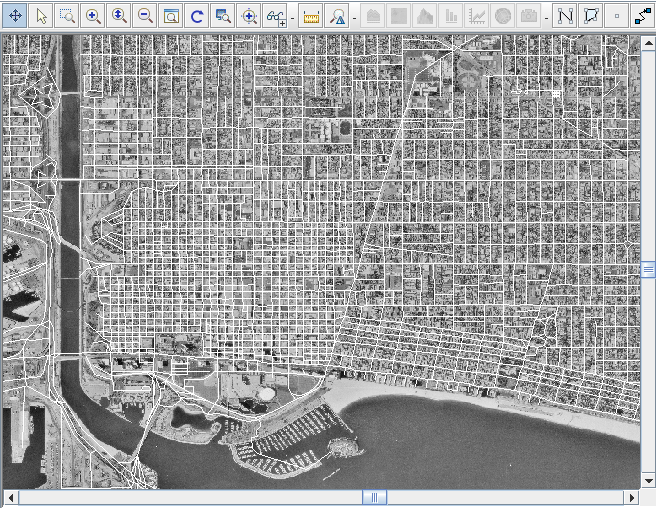
The data source LA_Streets
6. Choose Option>Show Tooltips on the Map to enable the display of tooltips when you move the mouse pointer over the map.
7. Click the
8. 9. button, and zoom in on the part of the LA_Houses.tif and LA_Streets.shp data sources that are of interest to you.
The following figure shows the resulting Map View pane.
10. 
LA_Streets and LA_Houses
Saving the final map
Choose
File>Save Map As and save the map under the directory and name of your choice.
You have now completed the map and saved it. You can reopen the map at any time and make any changes to it that you want.
You can now, for example, begin to add your APP-6a symbols and deploy your forces for the defense of Los Angeles.
To save your current zoom setting, you can also create areas of interest (see
Managing areas of interest) which enable you to quickly locate and move between these saved areas.
Copyright © 2018, Rogue Wave Software, Inc. All Rights Reserved.
