The added value of JViews Maps for Defense
Presents the key benefits of JViews Maps for Defense.

Gives an overview of the benefits of
JViews Maps for Defense.
Explains why
JViews Maps for Defense can display complex maps.
Explains why
JViews Maps for Defense brings performance.
Describes the advantages of component libraries.
Describes the advantages of the Map Builder.
Describes the map data formats that are handled by
JViews Maps for Defense.
Presents more advanced features for map animation.
Overview
Rogue Wave® JViews Maps for Defense is the solution for delivering asset-management map displays. Its completely open API is designed to hide the complexity of building such displays by handling all the lower-level mapping engine functionality. You can concentrate on the data you want to display, rather than map formats, projections, spatial reference systems, huge data sets, and so on.
JViews Maps for Defense provides a unique combination of advanced technology support and in particular:
High performance background maps for zooming, panning, rotating, and so on.
Advanced overlays as symbols that can, for example, change state according to specific sensors.
Using the
JViews Maps for Defense advanced technology you can mix rich background maps with interactive foreground objects. A mixture of the two is required by most if not all supervision applications needed to monitor assets within their earthly context (town map, country map, or building floor plans). Refer to
Before you start to understand the purpose and relationship of background maps and the overlay parts of
JViews Maps for Defense.
In general, Geographical Information Systems (GIS) focus on map creation, such as placing news roads or buildings on a map, and map distribution across servers and networks. JViews Maps for Defense effectively complements GIS by reusing GIS data and by allowing for fast and efficient applications that permit quick background map development.
Display of complex maps
JViews Maps for Defense can display complex maps with numerous overlaid entities due to:
Advanced rendering techniques
Smart data loading capabilities
Multithreaded components
There is a full spectrum of map display capabilities, including the most popular data format readers and writers, geodesic computations such as projections, ellipsoids, and datum, and hundreds of predefined coordinate systems. JViews Maps for Defense lets you load maps quickly and create and animate multilayered and multiscale maps with user-defined visual representations. This is achieved by styling properties such as colors or transparency.
Multithreaded components mean that lengthy operations happen in the background so that the application is never frozen waiting for a computation to end. Users can continue working on others tasks and see the results when they are ready. It also greatly helps to improve the perceived performance.
Performance
One of the most striking features is the accelerated performance that is due to load-on-demand and pixel-on-demand for handling very large data sets while minimizing memory footprint. Map labels contribute to easily readable displays. JViews Maps for Defense has efficient redraw options and the standard set of interactions such as panning, zooming, selecting, and annotating.
Component libraries
JViews Maps for Defense contains component libraries and not ready made tools with a defined feature set. This means that users can easily:
Modify or extend any existing features and behavior to fit their needs.
Design the application to fit their architecture and their specific needs.
This flexibility is important for freedom of choice in new application development and also allows the enrichment and extension of legacy applications.
Map Builder
The Map Builder is built from the libraries and is delivered in the source code. Although the Map Builder is a tool for defining the background maps of an application, it also serves three other functions important for getting started with the product quickly:
Map preparation tool: Using the Map Builder you can prepare a map that mixes different data sources (satellite, intelligence, transportation networks, …) and specify what you want to see, when you want to see it, and how you want to see it. This means that you always get a meaningful display, for example, you do not need to see streets at worldwide level.
SDK exploration: The Map Builder offers an easy way to accelerate your evaluation of the wide variety of features offered by the SDK.
Jump starting development: The Map Builder is delivered as source code and built using Rogue Wave®
JViews Maps for Defense SDKs. If you want, you can reuse code fragments in your final application.
With the Map Builder, you have access to multiple coordinates and measuring unit systems; contextual grids in Longitude and Latitude or the Military Grid Reference System (MGRS) with minimized memory and CPU footprint.
Map preparation
JViews Maps for Defense offers the fusion of vector, raster, and terrain elevation data. The data is reprocessed on-the-fly allowing you to mix and match map data whatever its storage parameters are.
You can display contextual information by separating different contexts onto different layers, since different information is visible at different zoom levels if you use the zoom-sensitive look and feel. JViews Maps for Defense provides multilayered and scaled maps. You can define your own theme for a map by configuring individual layers differently.
Data formats
JViews Maps for Defense allows you to import many different map formats.
Vector formats:
KML and KML Zipped (KMZ) formats (
.kml,
.kmz ) (see
KML/ KMZ)
SVG files (.svg)
Defense specific vector formats:
Raster formats:
GIF
JPG
PNG
TIF/TIFF files
Defense specific raster formats:
Databases:
Terrain elevation:
The products offer facilities for exporting various vector, raster, and database formats:
Vector: ESRI Shape
Raster: GeoTIFF
Database: Oracle®
GIS transformations
Dynamic geodesic management is provided through:
1944 predefined coordinate systems (projection, ellipsoid, and datum parameters)
27 predefined projections plus user-defined
58 ellipsoid forms plus user-defined
Molodensky DATUM
Well Known Text (WKT) parsing
Contextual grids are supplied as:
Longitude and latitude
Military Grid Reference System (MGRS) (rather like the Universal Transverse Mercator (UTM) system)
JViews Maps for Defense offers multiple coordinate systems and the management of multiple units of measurement.
Advanced map animation
The use of a background map and symbols that can be moved in real time across the map, and which can be panned, zoomed and so on, provide advanced map animation features.
There are graphics editing facilities provided by the Symbol Editor for JViews Diagrammer to help you create your own custom symbols, see Developing with design tools>Using the Symbol Editor.
Palettes of predefined symbols, some of which conform to specific standards, such as
APP-6a (MIL-STD 2525B) in the defense domain, are also available. You can group symbols into hierarchies to define your own symbology and for greater visibility against the map.
Optimized performance
Modern applications often require large map data sets as satellite and
Unmanned Aerial Vehicles (
UAV) views or exhaustive transportation networks to realistically depict situations.
JViews Maps for Defense is optimized to efficiently handle such large data sets to provide video-like performance while minimizing memory requirements.
For example, by leveraging
load-on-demand and dynamic data subsampling, the memory footprint is minimized, even though the data contains millions of objects. Display performance is based on disk and RAM caching as well as advanced quadtree rendering and automated clipping and tiling. This performance not only provides a better experience for the user, but also saves processing time for other application CPU intensive tasks.
You will be impressed by the reactivity of the interactive zooming and panning, the storage and navigation facilities for Areas of Interest, and the map rotation capability for GPS-like application development.
Symbology
In addition to APP-6a symbols, JViews Maps for Defenseuses the rule-based presentation layer of JViews Diagrammer to update the appearance and position of assets when underlying application data, such as status or positions, evolve. You can create your own symbology and manipulate vector, raster, and complex objects. Symbols support hierarchical logical grouping. See Developing with design tools>Using the Symbol Editor for details of how to create your own symbols.
All the above features are directly available from the component libraries.
Defense-specific symbology
JViews Maps for Defense provides the NATO standard
APP-6a symbology library.
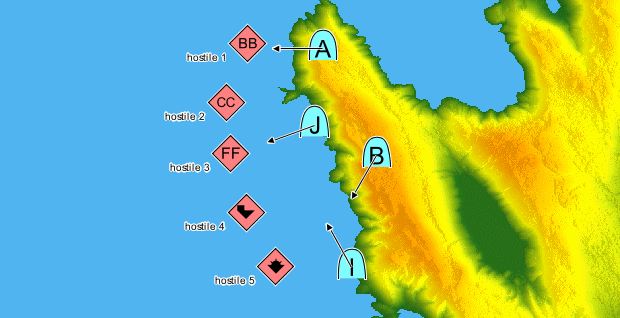
Map with APP-6a symbols
Decision support
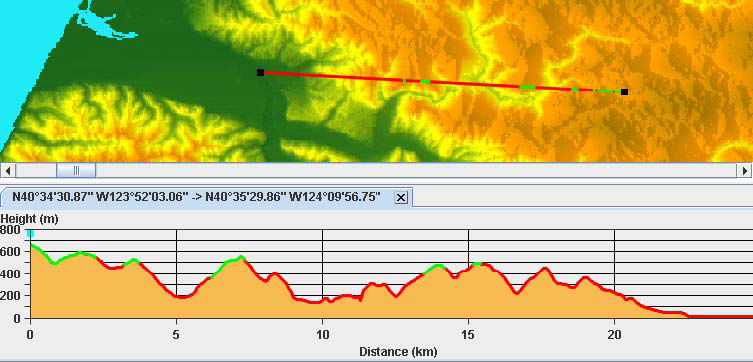
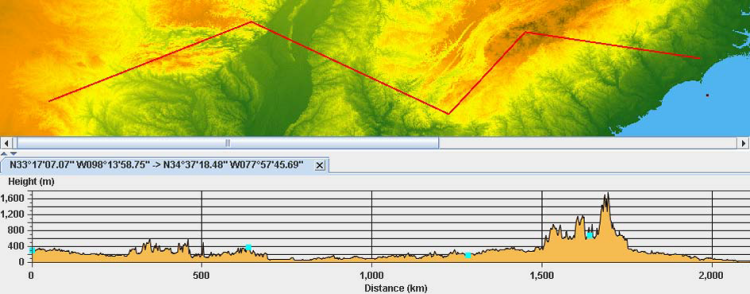
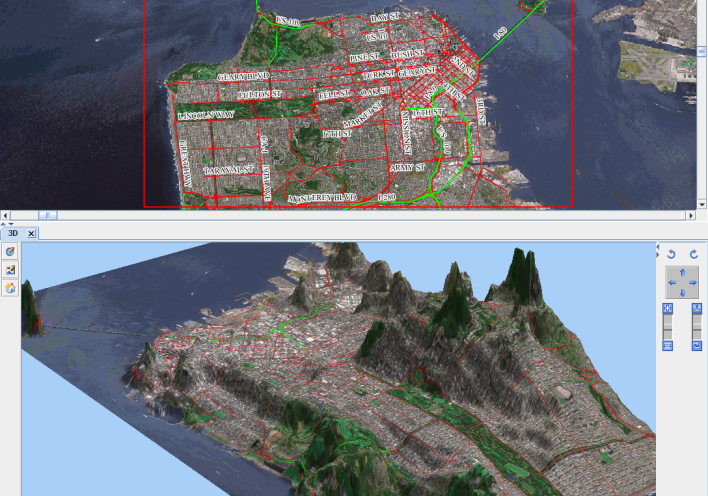
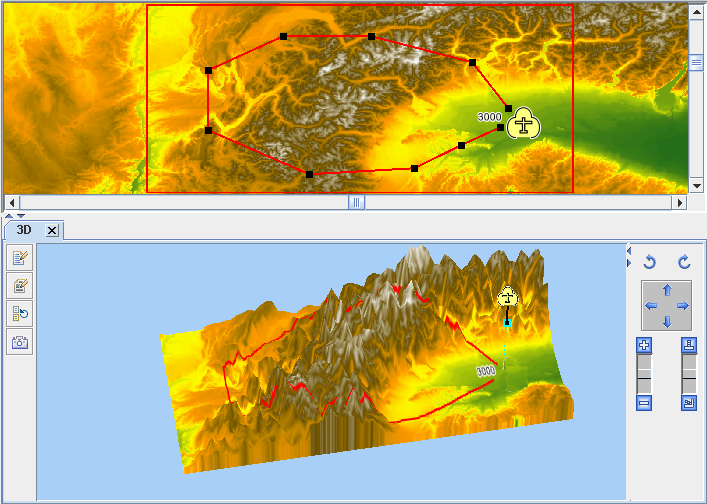
JViews Maps for Defense has a powerful terrain analysis feature to assist with decision making, whether in mission preparation or on the battlefield during mission execution.
Terrain analysis provides sophisticated features such as:
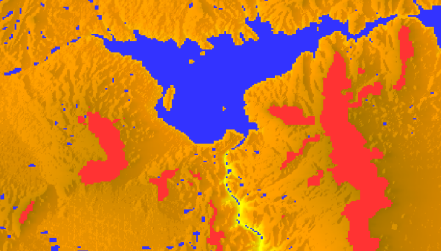
Line of Sight
Terrain Cut
3D View
Fly Through
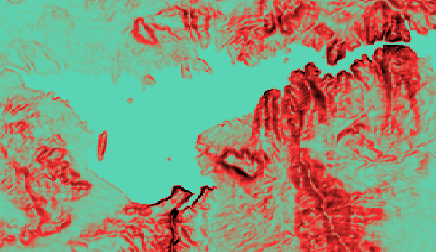
Area of Sight (Approximate and Detailed views)
Gradient Computation
World map in GeoTIFF format
There are APIs for data access and the integration of custom algorithms.
These features can be applied in the heat of battle, whether in formal conflict situations or partisan insurgency. They can also be applied in the fight to preserve homeland security.
Copyright © 2018, Rogue Wave Software, Inc. All Rights Reserved.