- java.lang.Object
-
- ilog.views.chart.IlvChartRenderer
-
- ilog.views.chart.renderer.IlvCompositeChartRenderer
-
- ilog.views.chart.renderer.IlvSimpleCompositeChartRenderer
-
- ilog.views.chart.renderer.IlvPieChartRenderer
-
public class IlvPieChartRenderer
extends IlvSimpleCompositeChartRenderer
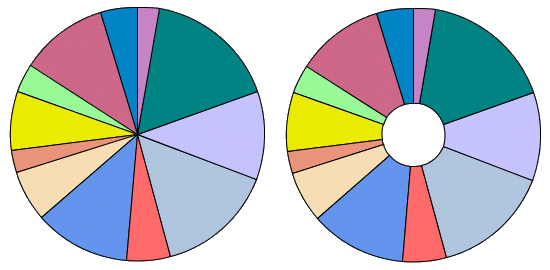
A renderer displaying pie and doughnut charts.The following figure illustrates the representation modes available for a pie renderer: as a pie on the left, as a doughnut (with a hole size of 25) on the right.

CSS example:
ilvPieChartRenderer {

     class : "ilog.views.chart.renderer.IlvPieChartRenderer";

     annotation : "@#ilvDataLabelAnnotation";

     holeSize : "2";

     name : "<value>";

     strokeOn : "false";

     styles[0] : "@#ilvStyle1";

     styles[1] : "@#ilvStyle2";

     visible : "false";

     visibleInLegend : "false";

     YAxisIdx : "2";

 }
-
-
Property Summary
Properties Modifier and Type Property and Description IlvDataAnnotationannotation
Specifies a global annotation for all the data sets displayed by this renderer.java.lang.Stringclass
Creates a new pie chart renderer.intholeSize
Sets the size of the hole in a doughnut chart.java.lang.Stringname
Sets the name of this renderer.booleanstrokeOn
Specifies whether the outline of the slices is drawn.IlvStyle[]styles
Sets the styles used by the child renderers.booleanvisible
Toggles the visibility of this renderer.booleanvisibleInLegend
Indicates whether the renderer appears in the legend.intYAxisIdx
Connects the specified renderer to the specified ordinate axis.
The default value of this property is
true, which means that the renderer will automatically create and add items to the legend.
CSS example:visibleInLegend : "false"; -
-
YAxisIdx
public int YAxisIdx
Connects the specified renderer to the specified ordinate axis.
CSS example:YAxisIdx : "2";