User Interfaces
The Gantt chart can display and edit data consistently by means of the Gantt chart manager and grapher views. These views are created inside the Gantt chart object and attached to a manager (two views for Gantt lines), and a grapher (four views for Gantt nodes and links).
Manager Views
The 2 manager views, which are on the left of the user interface, are created to display
IlvGanttLine objects. They are indexed as follows:
 0 top
0 top1 bottom Grids (
IlvGanttLineGrid objects) can be displayed in the manager views.
Grapher Views
The 4 grapher views, which are on the right of the user interface, are created to display
IlvGanttNode,
IlvGanttSubNode, and
IlvGanttLink objects. The grapher views are indexed as follows:
0 topLeft 1 topRight 2 bottomLeft 3 bottomRight By default, the four grapher views are visible. In the example provided (
Using the Gantt Chart Through Examples) one view is displayed while the other ones are hidden. The user can scroll these views by using the keyboard or mouse. Scrolling can be done step-by-step or page-by-page.
Grids can also be drawn in the grapher views.
Scales
Scales are associated with the grapher views, that is, there are two scales at the top of the views:
topleft (index
0) and
topright (index
1). In
IlvGanttChart, the scales are
IlvRectangularScale objects. Special interactors are installed on the scales and allow you to horizontally zoom the grapher views.
In
IlvGanttChartForm, the built-in
IlvRectangularScale scales are not used. Users can set customized scales to
IlvGanttChartForm. The sample
<ILVHOME>/samples/gantt/calendar shows a way of using time scales in
IlvGanttChartForm.
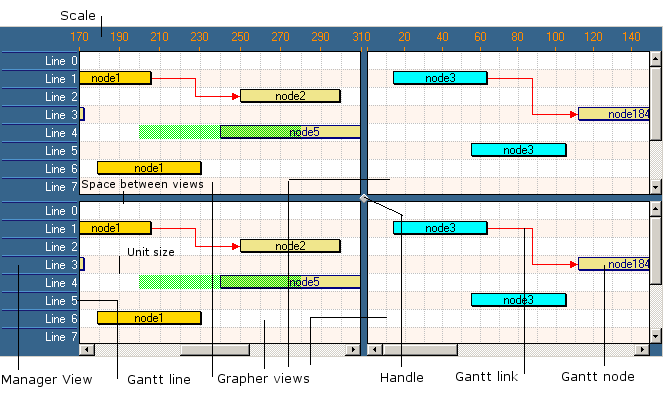
Figure 1.3 shows the main components of a Gantt chart:
Figure 1.3 Description of the Gantt Chart Found in the Month Sample
Version 6.0
Copyright © 2015, Rogue Wave Software, Inc. All Rights Reserved.