Case 1: Applying a Transformation
In this example, you will perform the following tasks:
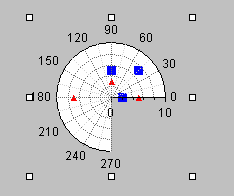
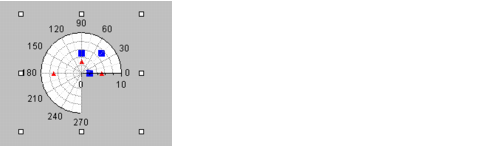
Figure 3.1 shows the chart you are going to create.
Figure 3.1 Polar Chart with Data in Radians on a Scale in Degrees
Creating a Polar Chart
Because our example chart is based on a polar chart, the first thing you must do is create the chart.
2. Drag a polar chart from the Charts palette to your working buffer.
3. Double-click this object to open its inspector.
See
Using the Chart Inspector for an overview of the Chart inspector. This section contains an explanation of each notebook page you may need to use when working with charts.
4. At this stage, it is a good idea to save the buffer containing your chart.
Make sure you select a directory to which you have write access. Also remember to save periodically as you work.
Defining Data with Abscissa Values in Radians
You are going to define two data sets, each consisting of three data points with two coordinates. The x-coordinate will be expressed in radians.
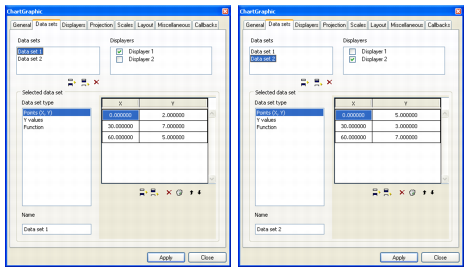
1. Click the Data sets tab in the Chart inspector to bring this page to the front.
To simplify the exercise, we are going to keep the data sets that are already defined. These data sets are of the type “Points (X,Y)” for the current chart. You can see that the abscissa values are expressed in degrees by default. For this exercise, you must therefore set the abscissa of the data points to radians in order to have data with abscissa values expressed in radians.
2. Select the first data set in the Data sets list.
3. Keep only the first three data points and delete the others. To delete a data point, just select it and click the Remove icon

below the table.
4. Click Apply to validate the changes.
5. Select the second data set and repeat step 3 and 4.
You have now two data sets with three data points each.
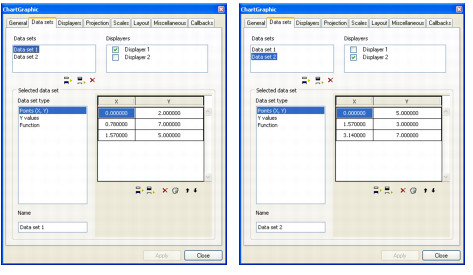
You are now going to select the abscissa value of each data point and replace the value in degrees by a value in radians.
6. Select the first data set again. Replace the first X value with 0, the second X value with 0.78, and the third X value with 1.57.
7. Click Apply to validate the changes.
8. Select the second data set. Replace the first X value with 0, the second X value with 1.57, and the third X value with 3.14.
9. Click Apply to validate the changes.
Defining the Displayers
We want the two data sets to be represented by markers. To do so, the displayers displaying the data sets must be of the scatter type.
1. Click the Displayers tab to bring this page to the front.
2. Select the first displayer from the Displayers list.
3. Make sure “Scatter” is selected in the Displayer type list. If not, select “Scatter”.
4. Click Apply to validate the changes.
5. Repeat steps 2 to 4 for the second displayer.
Specifying the Transformation on the Abscissa
Next you are going to apply a transformation to the abscissa scale.
The abscissa values of your data points are now expressed in radians. To represent these data points on an abscissa scale graduated in degrees, you have to do the following:

Specify the minimum and maximum values that will be represented by the scale.
Apply a transformation to the scale to convert radians to degrees.
Do the following:
1. Select the Scales page of the Chart inspector.
2. Make sure Abscissa is selected in the Scales list.
3. Make sure the General page is displayed in front.
On this page, you are going to change the minimum and maximum data values represented on the scale because these values must be expressed in the same coordinate system as the data.
4. Enter 0 in the Min field and 4.71 in the Max field.
5. Click Apply to validate the changes.
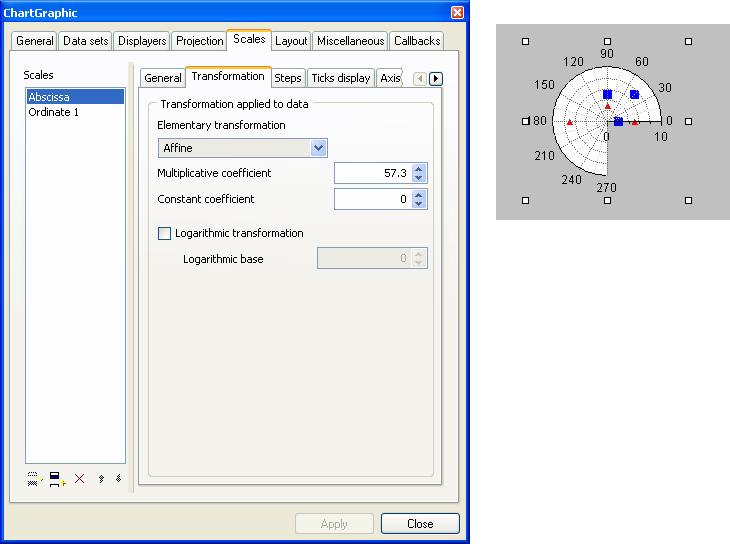
6. Click the Transformation tab on the Scales page.
The initial abscissa values of the data are expressed in radians while the abscissa scale of a polar chart is graduated in degrees by default. You will use the transformation page to set the transformation that will convert the abscissa values from radians to degrees. This transformation is given by the following formula:
where r is the value expressed in radians and d the corresponding value expressed in degrees.
7. Select Affine in the “Elementary transformation” drop-down list.
8. Enter 57.3 as the multiplicative coefficient and 0 as the constant coefficient.
9. Click Apply to validate the changes.
Your polar chart now represents your data expressed in radians on an abscissa scale graduated in degrees.
However, you may want to have an abscissa scale that is graduated in the same coordinate system as your data — in radians in this example. This case is detailed in the next section.
Version 6.0
Copyright © 2015, Rogue Wave Software, Inc. All Rights Reserved.