Displaying a Cursor
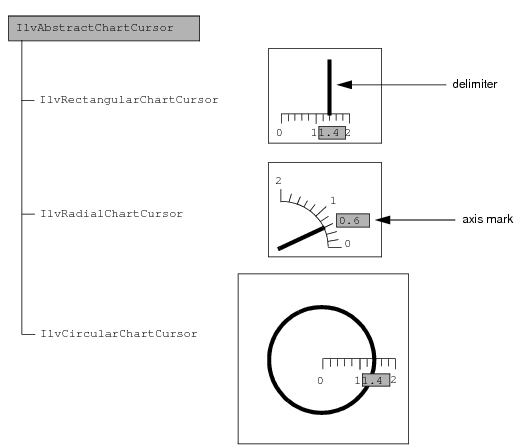
A cursor is a graphical indicator of a data value. A cursor is associated with a given scale and indicates the value corresponding to a given data point on this scale. It is composed of two distinct elements:

A
delimiter that crosses the data display area at the position of the data value
An
axis mark located on the scale. This axis mark indicates the data value at the level of the scale. It is made of a filled rectangle with a label.
The base class used to display a cursor is the
IlvAbstractChartCursor class.
Figure 10.5 shows all the classes displaying cursors that are defined in the Charts Library.
Figure 10.5 Hierarchy of Classes Displaying Cursors in the Charts Library
Version 6.0
Copyright © 2015, Rogue Wave Software, Inc. All Rights Reserved.