Side-by-Side Displayers
The base class used to represent data side by side is the
IlvSideBySideChartDisplayer class. The type of the child displayers that are created by default to be displayed is not specified at that level of the class hierarchy. However, it is possible to define the child displayers that will be created by setting one of the following:
See
Using Composite Displayers for details on these two objects.
The Charts Library provides one subclass of the
IlvSideBySideChartDisplayer class that defines the child displayers that are created by default:
IlvSideBySideBarChartDisplayer that displays the data as side-by-side bars.
A side-by-side displayer has the following basic characteristics:
Class | |
Category | Composite |
Number of real data sets visualized | As many as you want |
Can be used with all types of projections | Yes |
Number of child displayers | As many as the number of real data sets |
Subclasses | |
A side-by-side displayer displays as many data sets as you want. Within the graphical representation, the data items of the first data set appear first. The data items of the second data set then appear next to the data items of the first data set. The data items of the third data set then appear next to the second data set, and so on.
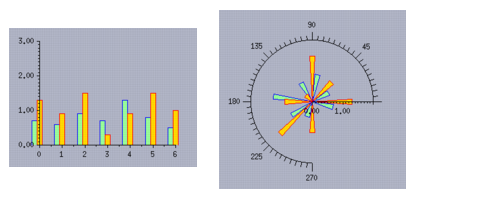
Figure 8.16 illustrates the fact that a side-by-side displayer can be used with all types of projections. Data sets are represented by a side-by-side bar displayer in a Cartesian chart (using a Cartesian projection) and in a polar chart (using a polar projection).
Figure 8.16 Side-by-Side Bar Displayers in a Cartesian Chart and in a Polar Chart
We can use the side-by-side bar displayer as an example. We can easily create this displayer by using the
IlvSideBySideBarChartDisplayer class.
IlvPalette* palettes[2]; palettes[0] = dpy->getPalette(dpy->getColor("palegreen"), dpy->getColor("blue")); palettes[1] = dpy->getPalette(dpy->getColor("gold"), dpy->getColor("red")); IlvSideBySideChartDisplayer* sideBySideDisplayer = new IlvSideBySideBarChartDisplayer(2, palettes); |
You can also create a side-by-side displayer directly from the
IlvSideBySideChartDisplayer class by specifying a displayer model or a displayer factory. See
Stacked Displayers to see how to create a displayer by specifying a displayer model or a displayer factory.
Version 6.0
Copyright © 2015, Rogue Wave Software, Inc. All Rights Reserved.