Charts > Using the Charts Library > Data Display > Using Single Displayers > High-Low Displayer
 
High-Low Displayer
A high-low displayer has the following basic characteristics:
Class
Category
Single
Number of real data sets displayed
2
Can be used with all types of projections
Yes
Items drawn
High-low items
The high-low displayer displays two data sets. The first data set is composed of the low values and the second data set is composed of the high values. A high-low item is drawn between each pair of low-high values, the low values being taken in order from the first data set and the high values being taken in order from the second data set.
The following properties are specific to a high-low displayer:
Property
Methods
Default Value
Width of a High-low Item
getWidth
setWidth
IlvChartDisplayerWidth
Width percentage of a High-low Item
getWidthPercent
setWidthPercent
100
Rise Palette
getRisePalette
setRisePalette
0
Fall Palette
getFallPalette
setFallPalette
0
If a width percentage is set, the width of the items is no longer constant but proportional to the zoom level of the chart.
Two palettes are defined: a rise palette and a fall palette. The rise palette is used to draw the high-low items for which the corresponding low value is less than the high value. The fall palette is used to draw the high-low items for which the corresponding low value is greater than the high value.
Figure 8.10 illustrates the fact that a high-low displayer can be used with all types of projections. Data sets are represented by a high-low displayer in a Cartesian chart (using a Cartesian projection) and in a polar chart (using a polar projection).
Figure 8.10    High-Low Displayers in a Cartesian Chart and in a Polar Chart
We can use the high-low displayer displaying the green and red high-low items as an example. We can create this displayer by using the following code:
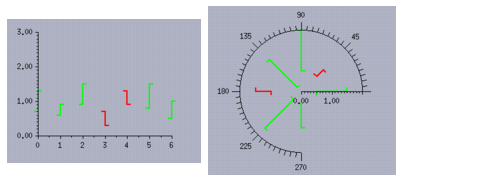
IlvPalette* risePal = dpy->getPalette(dpy->getColor("white"),
dpy->getColor("green"),0,0,0,0,2);
IlvPalette* fallPal = dpy->getPalette(dpy->getColor("white"),
dpy->getColor("red"),0,0,0,0,2);
IlvHiLoChartDisplayer* displayer =
new IlvHiLoChartDisplayer(IlvChartDisplayerWidth,
risePal,
fallPal);
Note: The Drawn Filled property has no meaning for the high-low displayer. The high-low items are simply drawn with the foreground color of the rise and fall palettes defined.

Version 6.0
Copyright © 2015, Rogue Wave Software, Inc. All Rights Reserved.