Class | |
Category | Single |
Inherits from | |
Number of real data sets displayed | 1 |
Can be used with all types of projections | Yes |
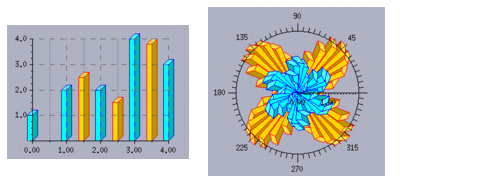
Items drawn | 3D bars  |
Class | |
Category | Single |
Inherits from | |
Number of real data sets displayed | 1 |
Can be used with all types of projections | Yes |
Items drawn | 3D bars |
Property | Methods | Default Value |
Depth of a 3D Bar | getDepth setDepth | IlvChartDisplayerDepth |
IlvPalette* palette = dpy->getPalette(dpy->getColor("gold"), dpy->getColor("red")); Ilv3dBarChartDisplayer* displayer = new Ilv3dBarChartDisplayer(IlvChartDisplayerWidth, IlvChartDisplayerDepth, palette); |
Note: By default, the 3D bars are outlined with the foreground color, the front face is filled with the background color, and the top and the side faces are filled with shadow colors computed from the background color. The 3D bars will be displayed only with the outline if the Drawn Filled property is set to IlvFalse. |