Class | |
Category | Single |
Inherits from | |
Number of real data sets displayed | 1 |
Can be used with all types of projections | Yes |
Items drawn | Polygon  |
Class | |
Category | Single |
Inherits from | |
Number of real data sets displayed | 1 |
Can be used with all types of projections | Yes |
Items drawn | Polygon |
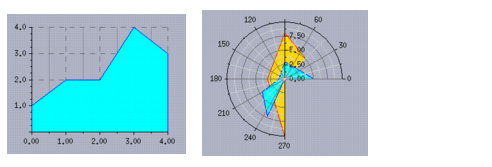
IlvPolygonChartDisplayer* displayer = new IlvPolygonChartDisplayer(); displayer->setForeground(dpy->getColor("blue")); displayer->setBackground(dpy->getColor("cyan")); |
Note: By default, the polygon is outlined with the foreground color and filled with the background color of the defined palette. It will be displayed only with the outline if the Drawn Filled property is set to IlvFalse. |