Drawing the Graphical Representations of Data
Each graphical representation of data is displayed within a chart by a dedicated object called a displayer.
The base class used to represent a displayer is the
IlvAbstractChartDisplayer class.
The displayers are divided into two categories:
 Single displayers
 display data with a single, basic rendering shape. Examples of such displayers are the displayers representing data with markers, polylines, bars, and so on.
Composite displayers display data using a combination of several rendering shapes. These displayers can display more complex graphical representations of data. Examples of such displayers are the displayers representing data with a marked polyline, stacked bars, and so on.
Composite displayers are defined as a combination of other displayers, which can be either single displayers or other composite displayers. For example, a marked polyline displayer is composed of two single displayers (one representing data with a polyline and one representing data with markers). A stacked bar displayer is composed of several single displayers representing data with bars.
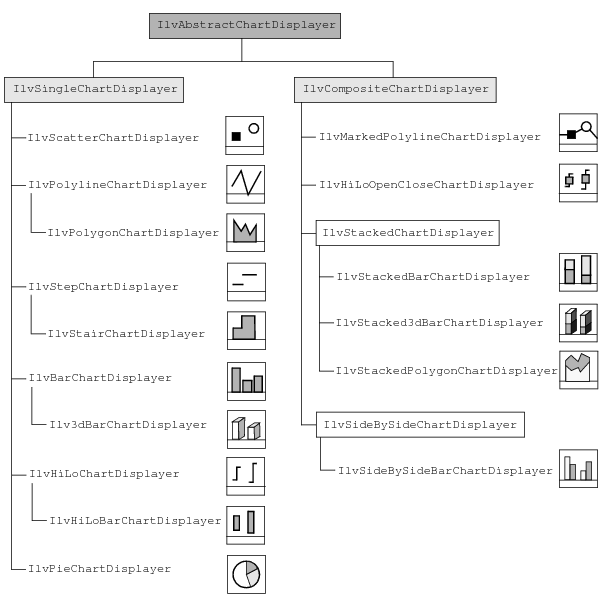
Figure 8.1 shows the hierarchy of all the displayers defined in the Charts Library. On the left are the single displayers and on the right are the composite displayers.
Figure 8.1 Hierarchy of Displayers in the Charts Library
A displayer can be used to display one or more data sets, depending on the type of the displayer. For example, a displayer that represents data with bars displays a unique data set, and a displayer that represents data with a high-low representation displays two data sets. For a given displayer, it is important to distinguish between two kinds of data sets:
Real data sets are the data sets that are to be displayed by the displayer and that you set on the displayer. These data sets should be stored in the chart data object that is set on the chart object using the displayer.
Virtual data sets are the data sets that are constructed just when needed for drawing the graphical representation of the real data sets that you want to display with the displayer. Virtual data sets are constructed only in displayers that cannot directly display the real data sets and need to put the data into another format before displaying them. For example, a pie displayer needs a specific virtual data set to internally transform the real data set into a set of angle values that can be then displayed.
Note: If virtual data sets are defined for a given displayer, it is these data sets, constructed from the real data sets that are set on the displayer, that will actually be displayed by the displayer. Otherwise, the displayer will directly display the real data sets that are set on the displayer. |
Setting General Properties
The following properties are defined for all the displayers:
Property | Methods | Default Value |
Drawing Properties |
Visibility | isVisible setVisible | IlvTrue |
Palette | getPalette setPalette | 0 |
Palette Foreground | getForeground setForeground | 0 |
Palette Background | getBackground setBackground | 0 |
Miscellaneous |
Name | getName setName | 0 |
Flags | getFlags setFlags | 0 |
Legend Text | getLegendText setLegendText | 0 |
Parent Displayer | getParentDisplayer setParentDisplayer | 0 |
If the considered displayer is a single displayer, a unique palette will be set by means of the
setPalette method. Otherwise, if the displayer is a composite displayer, a palette can be set for each child displayer that makes up the composite displayer.
If no palette has been specifically defined for a given displayer, the displayer will use the palette set on the chart object that uses the displayer.
The Legend Text property is used to define the text of a legend for the displayer. If no legend text is defined, the name of the real data set(s) displayed by the displayer will be used.
If a displayer is one of the displayers that make up a composite displayer, the method
IlvAbstractChartDisplayer::getParentDisplayer returns the composite displayer.
Version 6.0
Copyright © 2015, Rogue Wave Software, Inc. All Rights Reserved.