
The Horizontal Bar axis types are used to plot data values as bars which extend horizontally.
CX_AXIS_YX displays a numeric x-axis scale.
CX_AXIS_DATE_YX displays a date scale.
The isographic axis types, CX_AXIS_ISO_CLASSIC_YX and CX_AXIS_ISO_DATE_YX, add a pseudo three-dimensional look.
The data axis (X) is defined by an SRGDecimalScale object or SRGLogScale for logarithmic scaling, or SRGDateScale for date/time values. The other axis (Y) is defined by SRGIndexScale. The annotations from the data items (indices) in group 0 are used to label the axis.
The methods described above for changing the scaling and appearance of Classic axes also apply here.
When horizontal bar charts are used in a compound display, SRGraphStyle::SetHgraph(TRUE) must be called for the axes to be drawn correctly.
Axis types are supported by:
Horizontal Bar graphs
Extended Horizontal Bar graphs
Stacked Horizontal Bar graphs
Strata Horizontal Bar graphs
Strata Horizontal Bar by Group graphs
100% Strata Horizontal Bar graphs
100% Strata Horizontal Bar by Group graphs
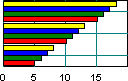
In a Horizontal Bar graph, the data values are indicated by the horizontal extent of individual rectangles.
The bars' appearance is determined by the settings in the style member of the individual data items. If the interior and frame styles of a data item are set to NONE, the style of the first group is used (SRGraphDataList object).
YX Classic or YX Iso Classic Axis. One group per series.
The Extended Horizontal Bar graph style gives the bars and axes a 3-D appearance.
YX Classic or YX Iso Classic Axis. One group per series.
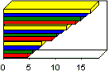
In a Stacked Horizontal Bar graph, the bars for different groups are displayed one behind another rather than side-by-side. The values from the different groups are not summed. The Strata Horizontal Bar graph is what some users expect for a stacked bar graph.
The bars' appearance is determined by the settings in the style member of the individual data items. If the interior and frame styles of a data item are set to NONE, the style of the first group is used (SRGraphDataList object).
YX Classic or YX Iso Classic Axis. One group per series.
CX_GRAPH_STRATAHBAR
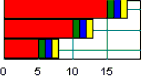
A Strata Horizontal Bar graph is what some users might call a stacked bar graph. It shows the summed total of a particular index over all groups. Because negative values can not be represented, a standard bar chart is drawn if the data contain negative values.
The appearance of the bars is determined by the settings in the style member of the individual data items. If the interior and frame styles of a data item are set to NONE, the style of the first group (SRGraphDataList object) is used.
YX Classic or YX Iso Classic Axis. One group per series. One bar per index.
CX_GRAPH_STRATAHBARG
This graph style reverses the roles of groups and indices—a bar is drawn for each group, with segments showing the contributions of each index. The labels for the y-axis are taken from the group headers.
The appearance of the bars is determined by the settings in the style member of the individual data items. If the interior and frame styles of a data item are set to NONE, then the global style of the display component is used.
YX Classic or YX Iso Classic Axis. One group per series. One bar per group.
CX_GRAPH_STRATAHBAR100
100% Strata Horizontal Bar graphs are similar to Strata Horizontal Bar graphs, except all the combined bars have the same length. Like a Pie graph, the relative importance of the contributing factors is displayed. These graphs highlight the variation of these contributions with time or place. In this style, a bar is drawn for each index with segments showing the relative contributions of each group.
Because negative values can not be represented, a standard bar chart is drawn if the data contain negative values.
The appearance of the bars is determined by the settings in the style member of the individual data items. If the interior and frame styles of a data item are set to NONE, the style of the first group (SRGraphDataList object) is used.
YX Classic or YX Iso Classic Axis. One group per series. One bar per index.
CX_GRAPH_STRATAHBARG100
This graph style reverses the roles of groups and indices—a bar is drawn for each group, with segments showing the relative contributions of each index. The labels for the y-axis are taken from the group headers.
The appearance of the bars is determined by the settings in the style member of the individual data items. If the interior and frame styles of a data item are set to NONE, then the global style of the display component is used.
YX Classic or YX Iso Classic Axis. One group per series. One bar per group.
Copyright © Rogue Wave Software, Inc. All Rights Reserved.
The Rogue Wave name and logo, and Stingray, are registered trademarks of Rogue Wave Software. All other trademarks are the property of their respective owners.
Provide feedback to Rogue Wave about its documentation.