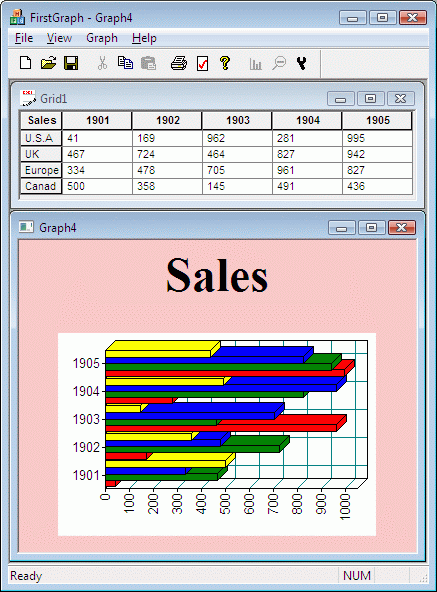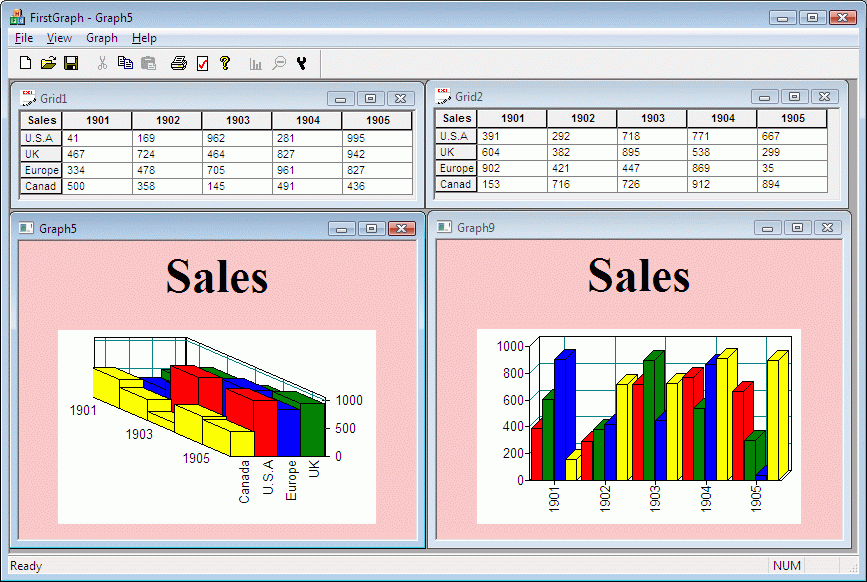

The images below show a data grid from which several charts have been generated. Graph1 and Graph2 are straightforward charts generated with minimum effort. The pie chart has been enhanced with a title panel with image fill, raised borders, and a display panel with a gradient fill.


Copyright © Rogue Wave Software, Inc. All Rights Reserved.
The Rogue Wave name and logo, and Stingray, are registered trademarks of Rogue Wave Software. All other trademarks are the property of their respective owners.
Provide feedback to Rogue Wave about its documentation.