Significance of the Model
In practice, several different measures exist for determining the significance, or goodness of fit, of a logistic regression model. These measures include the G statistic, Pearson statistic, and Hosmer-Lemeshow statistic. In a theoretical sense, all three measures are equivalent. To be more precise, as the number of rows in the predictor matrix goes to infinity, all three measures converge to the same estimate of model significance. However, for any practical regression problem with a finite number of rows in the predictor matrix, each measure produces a different estimate.
Commonly a regression model designer refers to more than one measure. If any single measure indicates a low goodness of fit, or if the measures differ greatly in their assessments of significance, the designer goes back and makes improvements to the regression model.
G Statistic
Perhaps the most straightforward measure of a goodness of fit is the G statistic, also refer to as the “likelihood ratio test.” It is a close analogue to the F statistic for linear regression. Both the F statistic and the G statistic measure a difference in deviance between two models. For logistic regression, the deviance of a model is defined as:
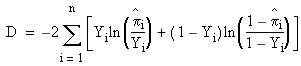
To determine the overall significance for a model using the G statistic, the deviance for the model and the deviance for the intercept-only model are subtracted. The larger the difference, the greater the evidence that the model is significant. The G statistic follows a chi-squared distribution with p – 1 degrees of freedom, where p is the number of parameters in the model. Significance tests based on this distribution are supported in the Business Analysis Module.
Pearson Statistic
The Pearson statistic is a model significance measure based more directly on residual prediction errors. In the most straightforward implementation of the Pearson statistic, the predictor matrix rows are placed into J groups such that identical rows are placed in the same group. Then the Pearson statistic is obtained by summing over all J groups:
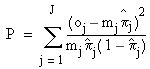
where oj is the number of positive observations for group j, pj is the model’s predicted value, and mj is the number of identical rows. The Pearson statistic follows a chi-squared distribution with J – p – 1 degrees of freedom, where p is the number of parameters in the model. Significance tests based on this distribution are supported in the Business Analysis Module.
Because the accuracy of this statistic is poor when predictor variable data are continuous-valued, the statistic in our implementation is obtained by grouping the predictor variable data. In other words, the data values for each predictor variable are replaced with integer values, the logistic regression parameters are recalculated, and the statistic is obtained from the resulting model. This tends to make the value of J much smaller, and the Pearson statistic becomes more accurate. In the -Business Analysis Module, the default number of groups for each predictor variable is 2.
Hosmer-Lemeshow Statistic
The Hosmer-Lemeshow statistic takes an alternative approach to grouping: it groups the predictions of a logistic regression model rather than the model’s predictor variable data, which is the Pearson statistic’s approach. In the implementation found in the Business Analysis Module, model predictions are split into G bins that are filled as evenly as possible, sometimes called “equal mass binning.” Then the statistic is computed as:
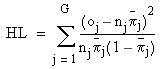
where oj is the number of positive observations in group j, pj is the model’s average predicted value in group j, and nj is the size of the group. The Hosmer-Lemeshow statistic follows a chi-squared distribution with G – 2 degrees of freedom. In the Business Analysis Module, the default value for G is 10.