Pearson Statistic
The Pearson statistic is a model significance measure based more directly on residual prediction errors. In the most straightforward implementation of the Pearson statistic, the predictor matrix rows are placed into J groups such that identical rows are placed in the same group. Then the Pearson statistic is obtained by summing over all J groups: 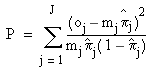
where oj is the number of positive observations for group j, πj is the model’s predicted value, and mj is the number of identical rows. The Pearson statistic follows a chi-squared distribution with J – p – 1 degrees of freedom, where p is the number of parameters in the model. Significance tests based on this distribution are supported in the Business Analysis Module.
Because the accuracy of this statistic is poor when predictor variable data are continuous-valued, the statistic in our implementation is obtained by grouping the predictor variable data. In other words, the data values for each predictor variable are replaced with integer values, the logistic regression parameters are recalculated, and the statistic is obtained from the resulting model. This tends to make the value of J much smaller, and the Pearson statistic becomes more accurate. In the -Business Analysis Module, the default number of groups for each predictor variable is 2.


