PV-WAVE-defined OpenMP Settings (Automatic Thread Control)
The first, and strongly recommended, method is to execute the provided procedure (OMPTUNE) to generate a file that contains the optimal OpenMP parameters for any array operation executed on your particular combination of hardware and operating system. Once the file is created, all subsequent PV-WAVE sessions can load this data by calling SET_OMP at the beginning of the session. Then any array operation will use the parameters which are optimal for that particular combination of hardware, operating system, mathematics, data type, and array size.
A comprehensive set of validation tests for automatic thread control (ATC) can be launched with the command:
OMPTSPEEDUPS, filename, ngbrwhere filename is the name of the tuning results file produced by OMPTUNE for the machine running OMPTSPEEDUPS, and ngbr is the number of gigabytes of RAM for that same machine. As with OMPTUNE, OMPTSPEEDUPS should be run without competition from other processes. Since a representative subset of all possible parallelized array operations is tested, OMPTSPEEDUPS takes a few hours to run, and it produces a large number of image files, each containing plotted test results for a particular mathematical operation. The large number of image files makes it advisable to launch the command from a new directory created to contain the images. Since the images are plots and thus mostly 'background', the entire directory can be zipped to less than 2MB. The plots produced by OMPTSPEEDUPS are called speedup-plots, and they show the speedups due to tuned parallelization via ATC.
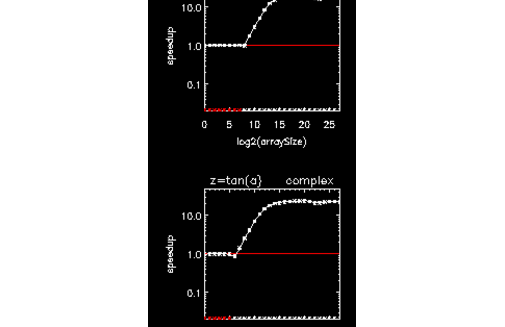
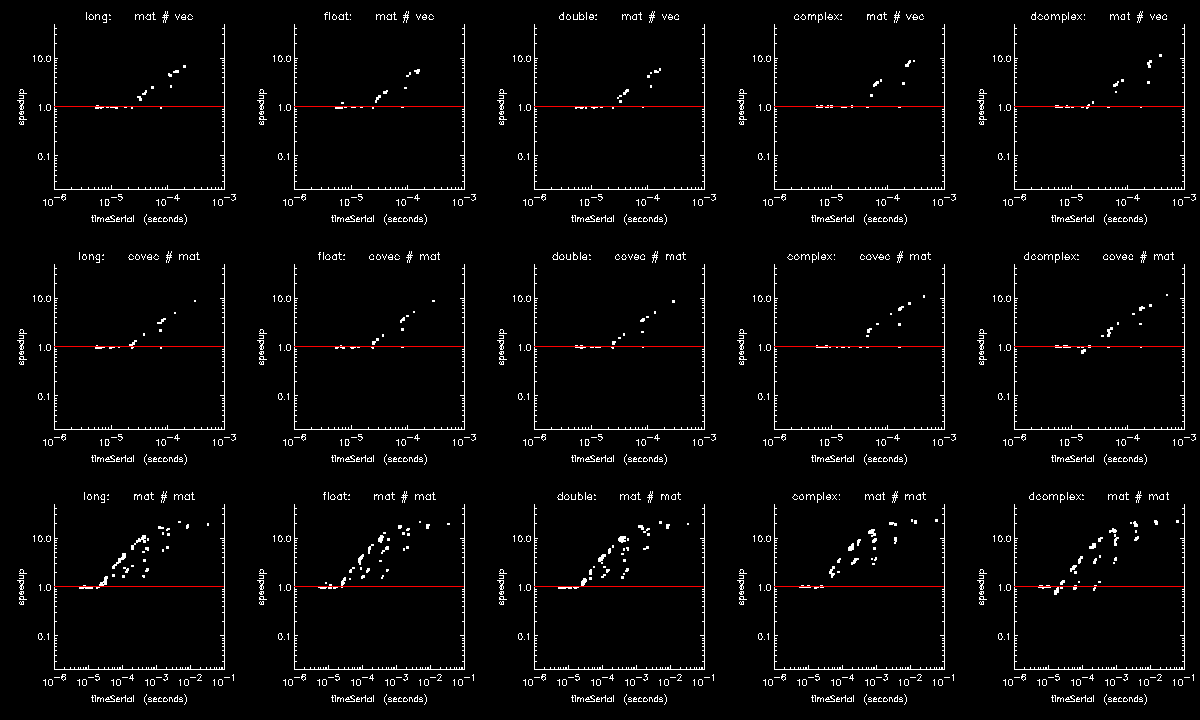
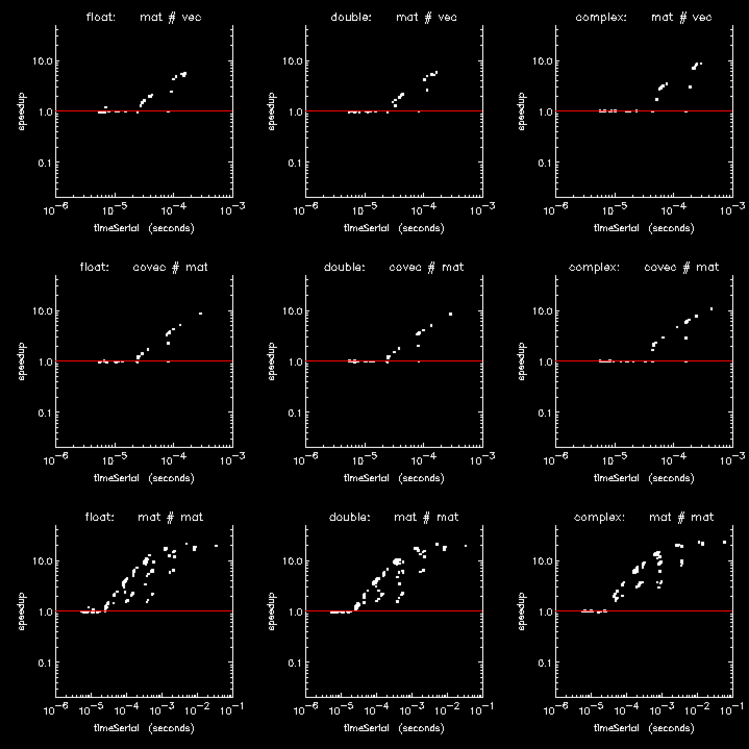
There are two types of plots, one for element-wise array operations and one for non-element-wise array operations. Each supported datatype of each math operation has its own speedup-plot, where operation and datatype are indicated by filename and plot title. Each element-wise operation can be performed like array+scalar, scalar+array, or array+array, where only array+scalar is tuned, but where each of the three variations is tested and plotted since it is implemented in its own C for-loop. The speedup-axis (the y-axis) is log-scaled so that a speedup of y and a slowdown of 1/y appears at the same distance above and below the no-speedup line (y=1) plotted in red. The data used to generate the plots have been randomized within ranges intended to simulate normal usage.
For element-wise operations the x-axis represents array size 2x, and for a multidimensional operation the x-axis represents the runtime of the operation run serially, i.e., on a single thread. Figure 15-1: 24-core Linux TAN and Figure 15-2: 24-core Linux MATMUL show speedups for an element-wise operation and a multidimensional operation, respectively.
In viewing a full set of speedup plots generated by OMPTSPEEDUPS, it is seen that parallelization threshold decreases dramatically with increases in the cost of the operation. For example the threshold array size for hyperbolic tangent is typically hundreds of times lower than the threshold array size for addition. This illustrates one reason ATC is important since an operation run in parallel below its threshold or run serially above its threshold will be significantly slower than if it were run with the right number of threads. Another reason why ATC is important is that on some platforms, the effective maximum number of threads varies dramatically from operation to operation and from array size to array size even past the parallelization threshold, with large performance penalties associated with using too many threads.
  |
  |
ATC Performance Improvements
ATC circumvents a common problem in array-programming: inefficient thread usage. The problem is best illustrated with a few plots.
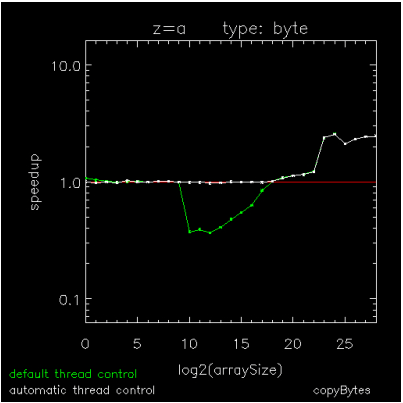
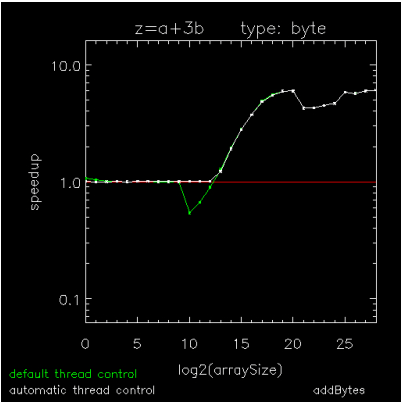
Figure 15-3: Copying an array of BYTEs through Figure 15-5: Hyperbolic Tangent of Double Complex values are speedup plots for copying a byte array, for adding a scalar to each element of a byte array, and for computing the hyperbolic-tangent of each element in a DCOMPLEX array. The x-axis indicates array sizes of 2x elements, the y-axis indicates speedups, the green curve indicates the default method of thread control where a loop is parallel if and only if it exceeds 999 iterations, and the white curve indicates ATC where a loop is run in parallel if and only if it has been predetermined to be faster than running it serially. The plots were generated on a Dell running RHEL6-64 with 2 X5650's each with 6-cores, 12MB cache, and hyper-threading turned off.
 |
 |
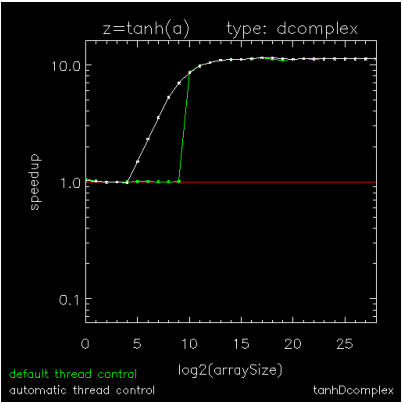 |
Figure 15-3: Copying an array of BYTEs and Figure 15-5: Hyperbolic Tangent of Double Complex values show extremes for parallelization threshold (the operation size above which parallelization is efficient) and Figure 15-4: Addition using BYTE values is an intermediate case. On this platform as on most platforms, parallelization threshold can vary by at least four orders of magnitude from one operation to the next, so using a fixed threshold impedes the performance of medium-sized operations with too many threads (Figure 15-3: Copying an array of BYTEs and Figure 15-4: Addition using BYTE values) or with not enough threads (Figure 15-5: Hyperbolic Tangent of Double Complex values). Although medium-sized array operations are computationally cheaper than the larger ones, they are just as important to optimize because they can sometimes dominate the work in an unparallelizable loop, itself composed of parallel array operations.
Any attempt to programmatically control the threshold in a large array-based program would be prohibitively time-consuming for the programmer.
Fortunately, the PV-WAVE programmer can launch a simple script that tunes PV-WAVE to any Linux or Windows platform. Once tuned to a particular platform, PV-WAVE automatically adjusts the number of threads at runtime so that it is always optimal for any operation in any PV-WAVE application running on that platform.
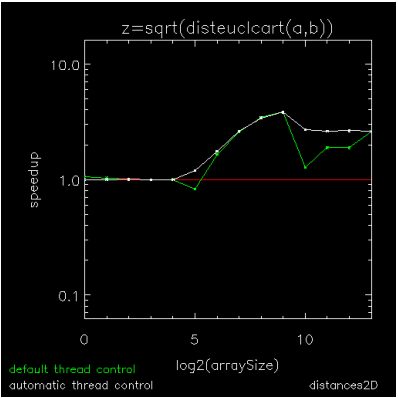
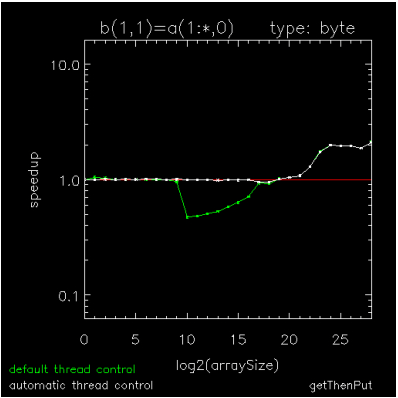
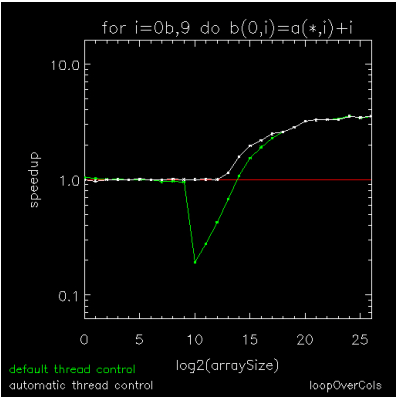
The previously discussed figures show how ATC improves the performance of individual element-wise array operations. Figure 15-6: Composition of several array operations through Figure 15-8: Looping over array columns with addition show how it improves the performance of multi-dimensional array operations and composites of array operations where the penalties associated with a fixed parallelization threshold can become compounded.
Figure 15-6: Composition of several array operations is a speedup plot for a composite of the several array operations (SQRT and those in disteuclcart.pro) used to compute the matrix of pair-wise distances between two sets of points.
Figure 15-7: Sequence of array subscripting operations shows the performance for a composite of operations used to replace part of a column in a 2D array with part of a column from another 2D array.
Figure 15-8: Looping over array columns with addition shows the performance of a sequence of operations similar to those show in Figure 15-7: Sequence of array subscripting operations, but where each replacement column has a scalar added to it.
The six speedup plots are typical of speedup plots for any operation or composite of operations, where ATC is seen to improve performance by degrees which vary with the operation and where the improvements are always limited to the intermediate sizes of the operation. Regardless of dimensionality, virtually all PV-WAVE array operations are subject to ATC: initializations, copies, reverses, tilings, type conversions, subscripting, searches, intersections, concatenations, transcendental functions, and logical, relational, arithmetic, matrix, and tensor operations.
 |
 |
 |


