Mapping with PV-WAVE
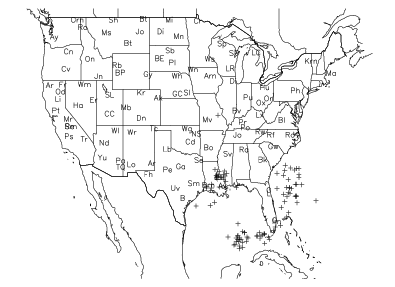
The PV‑WAVE mapping procedures let you create a variety of mapping applications. Scientific data, economic data, aerial photography data, and other kinds of data can be plotted with maps generated by PV‑WAVE, as shown in Figure 12-1: Lightning Strikes in the US.
 |
This section discusses how to use the PV‑WAVE mapping procedures, and includes the following topics:


