IPCLUSTER Function (PV-WAVE Extreme Advantage)
Performs image segmentation using K-means clustering based on regional statistical measures of the mean, mode, minimum, maximum, and/or range of the image pixels.
Usage
result = IPCLUSTER(image, cluster_seeds)
Input Parameters
image—A 2D or 3D array of any data type, except string or complex, containing an image; or image, row, or pixel-interleaved images.
cluster_seeds—A long array containing the pixel element numbers in image. These are used as the seed points with which individual clusters are identified. (2 ≤ cluster_seeds ≤ total pixels in image)
Returned Value
result—A 2D or 3D array of byte or integer data type containing the cluster number of each pixel in image.
Keywords
Fill_Mean—If set, clusters are filled with the mean value of the image pixels in that cluster.
Fill_Values—An array of values greater than 0 and less than or equal to the number of cluster seeds which are used to fill the clusters.
Intleave—A scalar string indicating the type of interleaving of 3D input image arrays. Valid strings and the corresponding interleaving methods are:
Maximum—If set, the maximum of each window (as defined using Wxdim and Wydim) in image is used as a statistic for clustering algorithm.
Max_iter—The maximum number of iterations to use in clustering algorithm. (Default: 30)
Mean—If set, the mean of each window (as defined using the Wxdim and Wydim keywords) in image is used as a statistic for clustering algorithm.
Minimum—If set, the minimum of each window (as defined using Wxdim and Wydim) in image is used as a statistic for clustering algorithm.
Mode—If set, the mode of each window (as defined using the Wxdim and Wydim keywords) in image is used as a statistic for clustering algorithm.
Range—If set, the range of each window (as defined using the Wxdim and Wydim keywords) in image is used as a statistic for clustering algorithm.
Value—If set, the pixel value is used as a statistic for clustering algorithm.
Wxdim—The window width used for computing the image statistics. (Default: 3)
Wydim—The window height used for computing the image statistics. (Default: 3)
Discussion
The IPCLUSTER function computes a measurement vector for each individual pixel in image. The following keywords control the statistical measures used for the clustering algorithm: Mean, Mode, Minimum, Maximum, Range, and Value. If no statistical keywords are specified, the Mean and Mode are used as the default.
The IPCLUSTER function is a wrapper for the K_MEANS function. The K_MEANS function is a PV-WAVE:IMSL Statistics routine used to identify clusters in image based on similar statistical features. The K_MEANS function computes Euclidean metric clusters for the measurement vectors. This begins with initial estimates of the mean values of the clusters determined from the cluster_seed points.
note | The K_MEANS function requires that each cluster seed have a unique statistical property. The following informational message may appear when using the IPCLUSTER function: % Number of clusters reduced due to identical statistical measures. This indicates that some of the statistical measures for the cluster seeds are identical and have been eliminated from the clustering process. |
Example
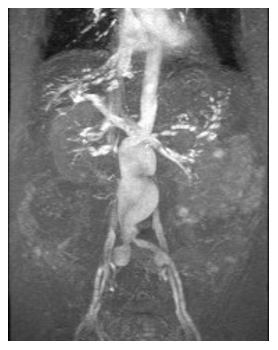
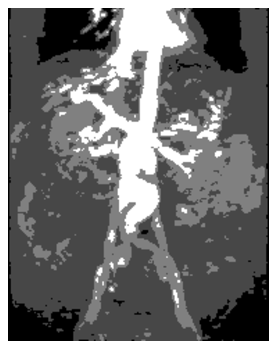
The results of this example are shown in Figure 10-14: Chest X-ray Image and Figure 10-15: Segmented X-ray Image.
; Read an image.
image = IMAGE_READ(!IP_Data + 'xray.tif')
IMAGE_DISPLAY, image
; Pick some random points for cluster seeds.
cluster_seeds = [20L, 15L + image('width') * 30L, $
137L + image('width') * 200L, 12L + 190 * image('width')]
; Segment the image using K_MEANS clustering.
seg_image = IPCLUSTER(image('pixels'), cluster_seeds, /Mean, $
/Mode, /Maximum, /Fill_Mean)
; Display the segmented image.
TVSCL, seg_image
 |
 |
See Also
In the PV-WAVE IMSL Statistics Reference: K_MEANS


