BAR2D Procedure
Creates a 2D bar graph.
Usage
BAR2D, [x, ] y
Input Parameters
x—(optional) Specifies a 1D array of x values. (Default: the index number in the y array)
y—Specifies a 1D array of y values.
Keywords
ColumnColors—An array of color indices specifying the colors to use for the column bars.
Outline—If nonzero, each bar is outlined. (Default: no outlining)
Additional BAR2D keywords are listed below. For a description of each keyword, see Chapter 21: Graphics and Plotting Keywords.
Discussion
This procedure creates a simple bar chart. To create more complex bar charts that include grouped and stacked bars, legends, and pattern-filled bars, see the BAR procedure.
Examples
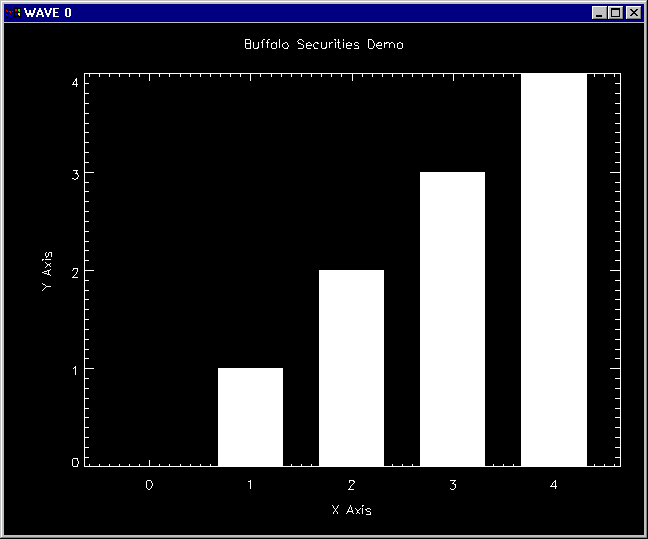
This example creates a simple bar chart, shown in Figure 3-4: 2D Bar Chart
y = FINDGEN(5)
TEK_COLOR
BAR2D, y, Title= 'Buffalo Securities Demo', Xtitle = 'X Axis', $
Ytitle = 'Y Axis'
 |


