Transforms and Spectrum Analysis
One of the most important operations in signal processing is transforming a signal from one domain to another to analyze and extract information. The PV‑WAVE Signal Processing Toolkit provides several functions and procedures for the Fourier and wavelet analysis of a signal. These routines are listed in Table 1-8: Transforms and Spectrum Analysis Routines. For detailed information, see Chapter 2: Reference (A to F) and Chapter 4: Reference (Q to Z).
Routine | Description |
|---|---|
DCMPLXFFT | Double-precision complex fast Fourier transform |
FFTCOMP | Fast Fourier transform |
FFTINIT | Fast Fourier transform initialization |
SPECTROGRAM | Spectrogram or short-time Fourier transform analysis |
SPECTRUM | Power spectrum analysis (power spectral density) |
WAVELET (*) | Wavelet transform |
* function uses digital filter data structure | |
The fundamental computational tool in signal processing is the fast Fourier transform (FFT). The PV‑WAVE Signal Processing Toolkit provides several methods of computing the FFT.
The SPECTRUM and SPECTROGRAM functions provide essential tools for Fourier analysis of stationary and non-stationary signals. Non-stationary signals can also be effectively analyzed using the WAVELET function, which computes the wavelet transform of a signal using compactly supported orthonormal wavelets.
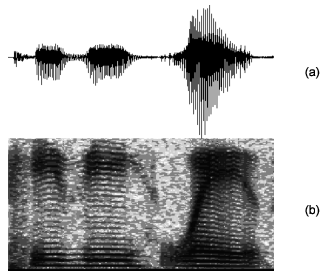
In the following example, SPECTROGRAM is used on a file containing a signal of a human voice.
(UNIX) To open the file on a UNIX system:
OPENR, u, GETENV(’RW_DIR’)+ $
’/sigpro-1_1/test/voice.dat’, /Get_Lun
OPENR, u, GETENV(’RW_DIR’)+ $
’/sigpro-1_1/test/voice.dat’, /Get_Lun
(WIN) To open the file on a Windows system:
OPENR, u, GETENV(’RW_DIR’)+ $
’\sigpro-1_1\test\voice.dat’, /Get_Lun
OPENR, u, GETENV(’RW_DIR’)+ $
’\sigpro-1_1\test\voice.dat’, /Get_Lun
x = BYTARR(7519)
READU, u, x
CLOSE, u
xs = 400
ys = 400
WINDOW, XSize = xs, YSize = ys
; Plot the original signal.
PLOT, x, Position = [0, .5, 1, 1], XStyle = 5, YStyle = 5, /Normal
; Compute the spectrogram of the original signal.
mat = SPECTROGRAM(x, 256)
; Display the spectrogram as an image.
TVSCL, HIST_EQUAL(CONGRID(ALOG10(mat > 1.e-5), xs, ys/2))
The original voice signal, a non-stationary signal with amplitude and frequency changing over time is shown in (a) of Figure 1-8: Processing and Displaying a Voice Signal. The resulting spectrogram image shown in (b) is the visual representation of the power spectral density of the signal versus time. The magnitude of the power spectrum image in (b) is indicated by the grey (or color) scale.
 |


