WgCeditTool Procedure
Creates a full-featured set of menus and widgets enclosed in a window; this window allows you to edit the values in PV‑WAVE color tables in many different ways.
Usage
WgCeditTool
Keywords
Cmap — The index of the color table to load when the widget is created; a positive integer in the range (0…18).
Parent — The widget or shell ID of the parent widget (long). If parent is not specified, WgCeditTool runs on its own (i.e., in its own event loop).
Position — A two-element vector specifying the x- and y-coordinates of the upper-left corner of the CeditTool window (long integer). The elements of the vector are [x, y], where x (horizontal) and y (vertical) are specified in pixels. These coordinates are measured from the upper-left corner of the screen.
Shell — The ID of the newly created widget. If the procedure fails, zero (0) is returned.
Title — A string containing the title that appears in the header of the CeditTool window. Default value is “Color Editor”.
Color/Font Keywords
For additional information on the color and font keywords, see Setting Colors and Fonts in the PV‑WAVE Application Developer’s Guide.
Background — Specifies the background color name.
Basecolor — Specifies the base color.
Font — Specifies the name of the font used for text.
Foreground — Specifies the foreground color name.
Discussion
Using the features of this window, you can edit individual color table values, or you can change ranges of values. (Range of colors can be selected and linearly interpolated.) You can use either sliders or a color wheel to adjust the current color.
You use a palette of color cells to select the current color — point to the color that interests you and click the left mouse button to select it. In this sense, the CeditTool window is like an artist’s palette, where basic colors are mixed to produce different colors.
You can use either the RGB, HLS, or the HSV color system to create a new color table, and you can view the result as a color bar or as a set of three intensity graphs. You can store color tables you have modified as custom color tables, and they will be available for your later use.
In some ways, the WgCeditTool window, shown in
Figure 19-3: WgCeditTool Window on page 1452, is similar to the WgCtTool window, in that it provides easy ways to interactively modify color tables. For example, with just a few clicks, you can use the WgCeditTool window to edit individual colors in the color table. Or you can use the
Options menu to open several other utility widgets. But if you do not need all the options of the WgCeditTool window, or if you just need a quick way to stretch or reverse a color table, then use the WgCtTool window, instead.
What is a Color Table?
On workstations that support color, the specific colors that are used depend on the current color table. A color table maps data values into colors. Many workstations support thousands of different colors, but only some number, usually 256, can be displayed at any one time.
By default, WgCeditTool uses as many colors in the color table as are currently available in the workstation’s colormap. This number depends on the colors that have already been allocated by other applications running on that workstation.
The Colors Common Block
This procedure modifies the PV‑WAVE internal color table, as well as the color table variables in the COLORS common block. Most color table procedures maintain the current color table in a common block called Colors, defined as follows:
COMMON Colors, r_orig, g_orig, b_orig, r_curr, g_curr, b_curr
The variables are integer vectors of length equal to the number of color indices. Your program can access these variables by declaring the common block. The modifications you make to the color table by interacting with the CeditTool widget are stored in r_curr, g_curr, and b_curr.
Custom Color Table File
The names of custom color tables that have been saved are stored in a file named .wg_colors. This file is placed in your home directory, which in UNIX is defined by $HOME.
note | Do not attempt to edit the .wg_colors file — doing so could lead to unpredictable results. |
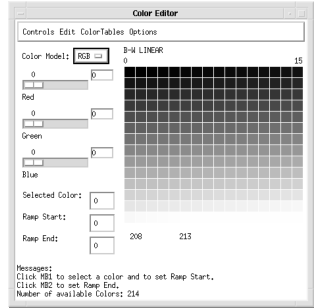
Contents of the Window
The CeditTool window has three main parts — the color palette area, the control area, and the message area. The options provided by the menu bar are discussed in a later section.
CeditTool Color Palette Area
An array of cells, one for each color index from the colormap. A message near the bottom of the window informs you how many colors were available to PV‑WAVE, and thus how many color cells could be displayed.
CeditTool Control Area
The window’s control area contains sliders, a menu, and text fields that are used to manipulate colors:
 Color Model (menu)
 — Choose a color system from the menu. By default, the CeditTool uses the RGB color system. For more information about color systems, refer to the section
Understanding Color Systems in the PV‑WAVE
User’s Guide.
Color Cell Text Fields and Sliders — These controls allow you to modify the three basic components of any color in the color table. The labels on the text fields and sliders change to coincide with the current color system. First, select a color to modify by clicking on one of the color cells in the display area, or by entering its index number in the
Selected Color text field. To modify the selected color, either enter a new color value in one of the text fields, or use the slider to change the value. If you enter a new color value into a text field, press
<Return
> to apply the new value to the slider and the color cell that corresponds to the selected color. If you use the sliders, the change is applied immediately as the slider moves.
Selected Color — The index number of the currently selected color in the color table. Once a color is selected, other sliders and text fields in the tool control area can be used to modify its composition. Select a color by clicking the left mouse button on a color cell in the palette of cells, or by entering the color’s index number in this text field and pressing
<Return
>.
Ramp Start and End — Two text fields where you can enter color table indices between which the CeditTool will perform a linear color interpolation; this is an easy way to edit the current color table. Either enter the beginning and ending color indices in the
Ramp Start and
Ramp End text fields or use the mouse to select the ramp’s starting and ending colors. (To use the mouse, click the left mouse button on the starting color cell and the middle mouse button on the ending color cell.) Select the
Ramp command from the
Edit menu on the CeditTool window. The affected cells in the displayed color table are updated immediately, although no permanent change is made until you save the color table as a custom color table.
CeditTool Menu Bar
The CeditTool menu bar consists of four menu buttons located near the top of the window:
Controls Menu
Save Custom — Save the current set of color indices using the same custom color table name as before.
Save As Custom — Save the current set of color indices as a new custom color table with a unique name.
Rename Custom — Rename a custom color table. You must select the custom color table from the Custom Color Table option menu (select the
Custom command from
ColorTables menu) before you can rename it.
Delete Custom — Delete one of the custom color tables from the list. For details about where this list of color tables is stored, refer to
"Custom Color Table File".
Exit — Destroy the CeditTool window and all its children.
Edit Menu
Ramp — Create a color ramp between the start ramp color and the end ramp color. See the description of
Ramp Start and
Ramp End on the previous page for more information about choosing start and end ramp colors.
Restore — Restore the original color map for the selected color table.
ColorTables Menu
System — Display a list of system color tables. System color tables are provided with PV‑WAVE and cannot be modified.
Custom — Display a list of custom color tables. These are color tables that you have created using
Save Custom or
Save As Custom command from the
Controls menu.
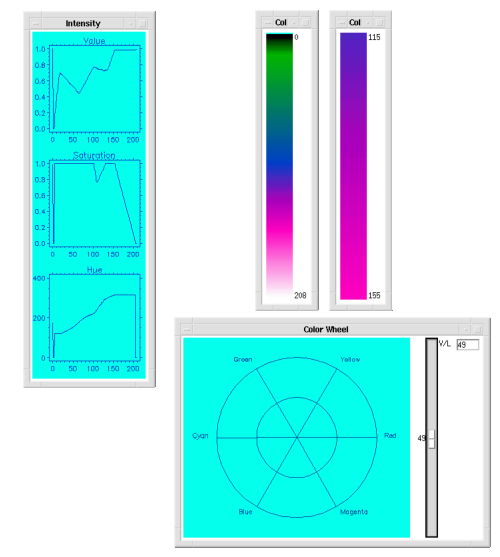
Options Menu
The characteristics you can adjust in the dial are: 1) hue (azimuth of mouse from the center), and 2) saturation (distance from the center).
The characteristics you can adjust in the vertical slider are value (in the HSV color system) or lightness (in the HLS color system).
note | The farther you click from the center of the wheel (with the left mouse button), the more saturated the color (for that particular hue). |
Intensity Graphs — The value of each of the three color system parameters (HLS or HSV) is plotted versus pixel value in a separate line graph. This results in three line graphs showing the current values of the three parameters for the current color table, as shown in
Figure 19-4: Utility Widgets on page 1458.
The color bar feature lets you display the colors of the current color table and “rotate” them. To rotate the color table using the color bar, press and drag the left mouse button up or down in the color bar.
If you have any other CeditTool options displayed on your screen, like the color wheel, you will see immediate effects as the color table shifts in relation to the mouse’s movement.
note | As you “slide” colors into different color table indices, the colors that “scroll off” the end of the table are added to the opposite end. |
Color Bar Range — Display a vertical color bar displaying only the range of selected colors; a partial-range color bar is shown in
Figure 19-4: Utility Widgets on page 1458. The range of selected colors is the same as the range chosen for the linear interpolation in the text fields
Ramp Start and
Ramp End.
Event Handling
You can use the CeditTool widget in one of the following two ways:
From the WAVE> prompt — Enter the procedure name at the
WAVE> prompt to display the CeditTool widget. The CeditTool widget handles its own event loop by calling WwLoop.
Stand-alone widget in its own window created by another application — The CeditTool widget has its own Main window, but the application (not the CeditTool widget) handles the event loop by calling WwLoop.
The output parameter shell can be returned only if you also supply the input parameter parent.
Example
Enter the commands shown in this example into a file, and compile the procedure with the .RUN command. If the variable parent is defined, WgCeditTool is created as a child of parent; otherwise, WgCeditTool runs on its own (i.e., in its own event loop).
When you are finished interacting with the WgCeditTool window, close it by selecting Exit from the Controls menu.
PRO Sample_wgcedittool, parent, tool_shell
; Create WgCeditTool as a child of "parent". The window of
; the newly created widget is returned via the optional
; output parameter "tool_shell".
IF N_ELEMENTS(parent) NE 0 THEN BEGIN
WgCeditTool, Parent=parent, Shell=tool_shell
ENDIF ELSE BEGIN
; Create WgCeditTool and display it as its own Main window.
; In other words, the WgCeditTool window runs on its own
; (i.e., in its own event loop).
WgCeditTool
ENDELSE
END
See Also
For more information about color table indices, refer to the PV‑WAVE User’s Guide.
For more information about color systems, refer to the PV‑WAVE User’s Guide.
For more information about how to write an application program based on PV‑WAVE Widgets, refer to the PV‑WAVE Application Developer’s Guide.
For more information about how to write an application program based on the PV‑WAVE Widget Toolbox, refer to the PV‑WAVE Application Developer’s Guide.
Version 2017.0
Copyright © 2017, Rogue Wave Software, Inc. All Rights Reserved.