Functional Demonstrations
The demonstrations available on the FUNCTIONAL DEMONSTRATIONS menu demonstrate the capabilities of PV-WAVE.
Basic Functions
The basic capabilities and functions available in PV-WAVE for reading and displaying 1D, 2D, 3D, and 4D data are showcased. The functions are:

Display ASCII Column formatted data as a 1D
x-y plot.

Display binary unformatted data as a 2D image.

Display ASCII Column formatted data as a 2D contour plot.

Display ASCII Column formatted data as a 3D mesh surface plot.

Display ASCII Column formatted data as a 4D shaded surface plot.
Business and Statistical Charts
This demonstrates various business charting applications in PV-WAVE. Several chart types are demonstrated, including Bar, Pie, Histogram, Probablity and Contour graphs. Some charts have several plotting options associated with them to demonstrate the use of optional keywords.
Array and Equation Manipulation
This demonstrates how PV-WAVE’s simple array manipulation syntax can be used to perform complex calculations. You can select from a list of 1D and 2D functions. PV-WAVE then plots the function over the selected data range.
Advanced Mathematics and Statistics
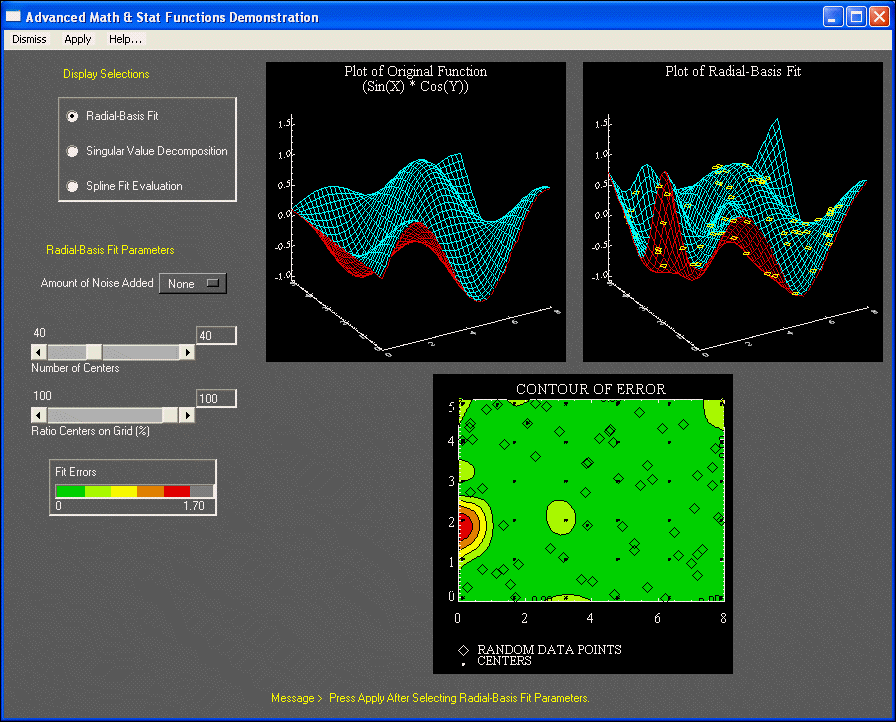
This demonstrates PV-WAVE’s ability to perform advanced numerical and statistical analyses. Hundreds of powerful data analysis and numerics functions are integrated, including linear systems of equations, interpolation and approximation, quadrature, differential equations, eigensystem analysis, correlation and regression, to mention only a few. The main functions that are highlighted by this demonstration are radial-basis fit, singular value decomposition, and spline fit analysis.
Mapping Functionality
This demonstrates how PV-WAVE can be used to create an assortment of maps using a variety of projections. How data such as lines, text, images, contours, and velocity vectors can be overlayed is also shown.
Each of the 13 examples demonstrates a different use of the MAP routines. In addition, if you click on the map in many of the examples, you will see how the MAP_REVERSE procedure can be used to interact with a map.
Mapping Application
This demonstrates how PV-WAVE can be used to perform a variety of mapping transformations using the built-in World Data Bank II database.
In addition to selecting mapping projections, this allows you to select a center point and zoom-in on a region of interest. PV-WAVE samples the large number of points and plots at a resolution appropriate to the scale of the current view and with a subset of the dataset which is currently visible. Reverse transformations are demonstrated, and grid lines can also be generated and displayed.
Advanced Rendering
This demonstrates some of the abilities of the RENDER function. The data used is a volumetric 3D array containing Magnetic Resonance Imaging (MRI) data of a human head.
RENDER has the following capabilities:

Diffuse polygon mesh rendering

Multiple planar slices through a volume

Rendering of translucent polygon meshes

Rendering multiple objects with different transformations

Generation of quadratic objects (sphere, cylinder, cone)

Rendering with multiple light sources
Simulations
This demonstrates shock wave propagation through a graphite-epoxy composite material. Researchers at the National Institute of Standards and Technology and Virginia Polytechnic developed this simulation technique in an effort to advance non-destructive materials evaluation techniques.
Table Tools
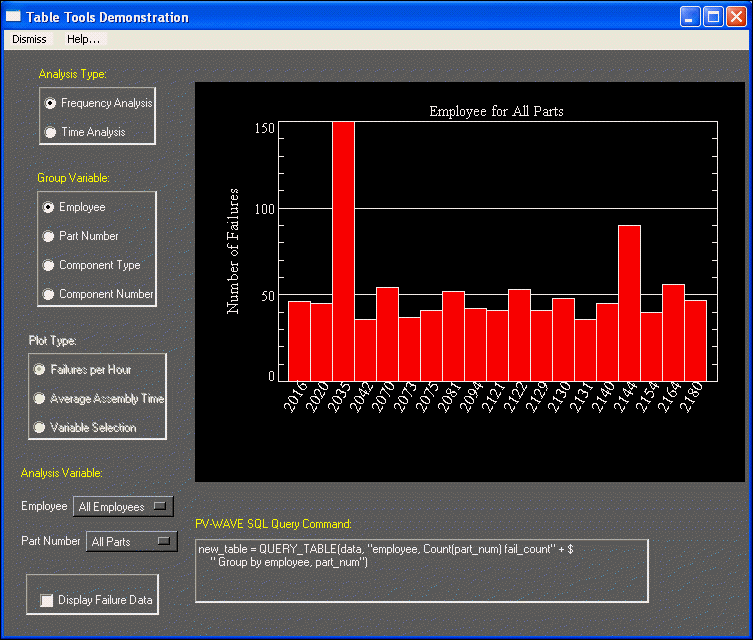
The Table Tools and Date/Time functionality are available in this demonstration, as shown in
Figure B-3: Table Tools Demonstration on page 218.
The data used is a table of 1000 records for electronic parts that failed control tests. The data includes information on who assembled the part, the part number, the time it took to assemble the part, the sub-component that failed within the part, the failed component type, the type of failure, and the date and time the part was assembled.
You can explore the data by using the Table Tools functions and view the different kinds of plot types available with the Date/Time functions.
VTK OpenGL Functionality
By including the Visualization Toolkit (VTK) as part of PV-WAVE, users now have an easy way to incorporate OpenGL graphics into their analysis and visualization.
Many high-level routines parallel existing PV-WAVE procedures, so that using this OpenGL addition is as simple as replacing "Surface, z" with "vtkSurface, z".
Version 2017.0
Copyright © 2017, Rogue Wave Software, Inc. All Rights Reserved.

