Returning Graphics to the Client
In
Client Java Application we demonstrated a simple JWAVE application that returned a numerical result to the client. To accomplish this, we used a JWaveExecute object. The JWaveExecute class provides methods for setting and getting parameters (and data), and executing JWAVE wrapper functions on the server; however, a JWaveExecute object can only retrieve numerical and string data returned from the client. If you want your client to retrieve graphical information from the server, then you must use a JWaveView object and a JWaveCanvas or a JWavePanel.
JWaveCanvas and JWavePanel Class
The JWaveCanvas is a subclass of java.awt.canvas component class. JWavePanel is the swing version of JWaveCanvas, it is a subclass of javax.swing.JPanel. Both classes provide a canvas for displaying a viewable object. When a plot is returned from the wrapper function, the JWaveCanvas or JWavePanel class paints the chart to the screen.
Since these classes are designed to display graphics or a JWAVE Viewable object, it is required to inform the canvas class of the graphic. This is done using the setViewable method. The setViewable method is used to display the Viewable object retrieved from the JwaveView instance and updates the canvas with the new graphics. There are subclasses of the JWaveCanvas and JWavePanel class that can be used to interact with the graphics. These classes are described in
Advanced Graphics Features.
Viewable Object
The Viewable object contains any graphics, such as plots and images, that are returned from PV-WAVE. This object knows how to paint itself onto a component. This object also retains information about fundamental graphics characteristics, such as size, coordinates, and resizing. Use the
setPreferredResizeMode to indicate whether or not the graphics are to be resized by the draw method. Several methods exist for transforming to and from PV‑WAVE data coordinates and 2D pixel coordinates. A getDataBounds method is useful for retrieving the region depicting the data drawn by the wrapper function. These methods are described in the section
"Resizing Graphics" and the section
"Coordinate System Transformations" of this chapter.
JWaveView Class
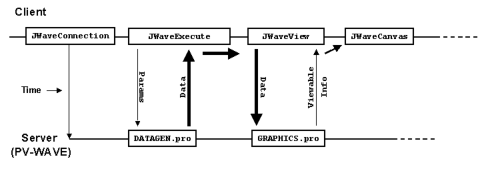
The JWaveView class is a subclass of the JWaveExecute class. Unlike JWaveExecute, JWaveView gets a Viewable object from the server. The Viewable object is returned by the JWAVE wrapper function.
JWaveView Object shows a typical JWAVE scenario where graphical data is created on the server and returned to the client.
note | In this example, data is physically returned from the server to the client. A more efficient method of handling the data is with a data proxy object. For more information on data proxies, see
Managing Data. |
Sample Code
To display a JWAVE chart, create a class that extends JWaveCanvas. This class creates a Viewable object returned from a JWAVE wrapper function that generates graphics (for example, if the wrapper calls the PLOT procedure). The setViewable method is used to register the Viewable object with the parent JWaveCanvas class. The JWaveCanvas class actually paints the chart to the screen.
class MyChart extends JWaveCanvas {
    MyChart()  throws JWaveException {
        JWaveView view = new JWaveView("myWrapper");
        // Set the size of the Viewable object.
        view.setViewSize(getSize());
        // Execute the JWAVE wrapper function.
        view.execute();
        setViewable(view.getViewable());
    }
}
Example: Displaying a Simple 2D Plot
This example lists a Java client program that displays a 2D plot generated by PV‑WAVE. The wrapper, simple_view.pro, lists the JWAVE wrapper that creates the 2D plot.
This example (the client Java program) is similar to the demonstration program, ViewTest.java, which you can find in:
(UNIX) RW_DIR/classes/jwave_demos/tests
(WIN) RW_DIR\classes\jwave_demos\tests
The actual code for this example, SimpleView.java, can be found in:
(UNIX) RW_DIR/classes/jwave_demos/doc_examples
(WIN) RW_DIR\classes\jwave_demos\doc_examples
The wrapper, simple_view.pro, can be found in:
(UNIX) RW_DIR/jwave-3_6/lib/user/simple_view.pro
(WIN) RW_DIR\jwave-3_6\lib\user\simple_view.pro
where RW_DIR is the main Rogue Wave installation directory.
The first component class is MainFrame. It is a frame that holds the chart. It registers a WindowListener on itself so that it can cause the application to exit when the user selects the exit icon on the frame.
The other component class is Chart. It is a JWaveCanvas that communicates with the Jwave server to run the JWAVE wrapper SIMPLE_VIEW. The class Chart sends the parameters BACKGROUND, COLOR, GRIDSTYLE, TICKLEN, and Y to the server. In response, the viewable is updated and the chart is drawn by the parent class JWaveCanvas.
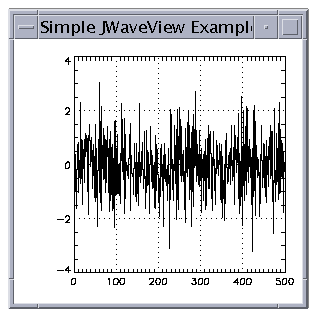
Figure 4-2: SimpleView Plot on page 48 shows the plot that is displayed on the Client.
SimpleView.java displays a 2D plot generated by PV-WAVE
import com.visualnumerics.jwave.*;
import java.awt.*;
import java.awt.event.*;

public class SimpleView extends Frame {
    /** Construct the frame that holds a chart */
    public SimpleView() throws JWaveException {
        MainFrame mainFrame = new MainFrame();

        // Add a chart to the frame
        final Chart chart = new Chart();
        mainFrame.add(chart);
        // Make the frame visible and draw the chart
        mainFrame.setVisible(true);
        chart.update();
    }
public static void main(String[] arg) throws JWaveException {
        SimpleView me = new SimpleView();
    }
}
class MainFrame extends Frame {
    MainFrame() {
        setTitle("Simple JWaveView Example");
        setSize(300,300);

        // so Exit button (window menu) will work
        addWindowListener(new WindowAdapter() {
            public void windowClosing(WindowEvent event) {
                System.exit(0);
            }
        });
    }
}
class Chart extends JWaveCanvas {
    public void update()  throws JWaveException {
        // Use SIMPLE_VIEW wrapper function
        JWaveView command = new JWaveView("SIMPLE_VIEW");

        // Set view size same as canvas
        command.setViewSize(getSize());

        // Set some colors and parameters
        command.setNamedColor("BACKGROUND", Color.white);
        command.setNamedColor("COLOR", Color.black);

        command.setParam("GRIDSTYLE", 1); // dotted grid lines
        command.setParam("TICKLEN", 0.5); // full grid
        command.setParam("Y", 500); // Number of data points
        // Execute the command
        command.execute();

        // Retrieve the Viewable and give it to the JWaveCanvas
        // JWaveCanvas repaints when it gets a new Viewable
        setViewable( command.getViewable() );

        // Close connection, as we are done with the session
        command.getConnection().shutdown();
    }
}
JWAVE wrapper simple_view.pro
FUNCTION SIMPLE_VIEW, client_data
; Retrieve parameter data
n = GETPARAM(client_data, 'Y', /Value, Default = 100)
grid=GETPARAM(client_data, 'GRIDSTYLE', /Value, Default = 0)
tick=GETPARAM(client_data, 'TICKLEN', /Value, Default = 0.2)
back = GET_NAMED_COLOR('BACKGROUND', Default = '000000'xL)fore = GET_NAMED_COLOR('COLOR', Default = 'ffffff'xL); Generate some “data” - n points
vals = RANDOMN(seed, n)
; Make the plot
PLOT, vals, Ticklen = tick, GridStyle = grid, $
Background = back, Color = fore
; Return the data (default data name DATA).
RETURN, vals
END
Version 3.6
Copyright © 2017, Rogue Wave Software, Inc. All Rights Reserved.


