USERSYM Procedure
Lets you create a custom symbol for marking plotted points.
Usage
USERSYM, x[, y]
Input Parameters
x, y—Vectors containing the x and y vertices of the symbol to be created. In the case of vector-drawn symbols, these vertices are connected, in order, with vectors forming the symbol. The number of points in the x and y vectors must be at least 2 and no more than 49.
If only x is specified, it must be a (2, n) array of vertices, with element (0, i) containing the x-coordinate of the vertex, and element (1, i) containing the y-coordinate.
Keywords
Color—An integer specifying the color used to draw the symbols, or used to fill the polygon. (Default: the line color)
Fill—A flag which, if set, fills the polygon defined by the vertices. If Fill is not set, lines are drawn connecting the vertices.
Thick—The thickness of the lines drawn in constructing the symbol. (Default: 1.0)
Discussion
The x and y parameters are offsets from the data point, in units of approximately the size of a character. In other words, a value of 1 corresponds to the actual x or y size of a character, while a value of .5 is equal to one-half the character size.
Symbols may be drawn with vectors or may be filled. Symbols may be of any size and may have up to 50 vertices. To use a user-defined symbol, set the value of the Psym plotting keyword or the !Psym system variable to +8 or –8.
Example
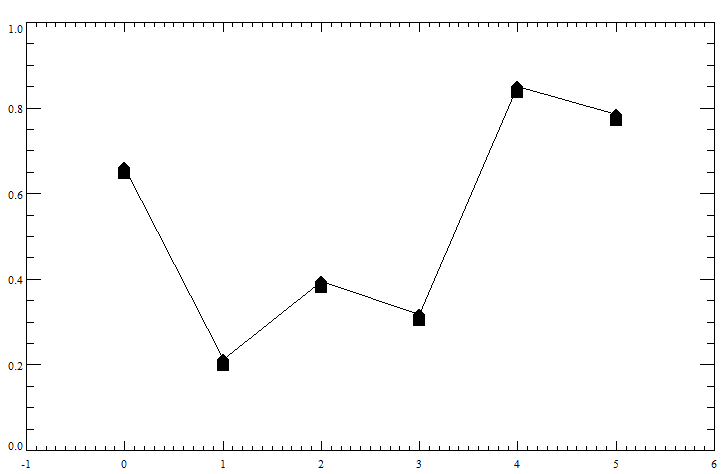
This example uses USERSYM to define a plotting symbol that resembles a house. The Fill keyword is used to fill the interior of the polygon defining the house. Six random points are then plotted using the house symbol to mark the data points.
The
Psym keyword, in the call to PLOT, is given a value of –8 so that the data points are connected by lines. Also, the
Symsize keyword is used with a value of 6 to increase the size of the plotting symbols. This example uses PV-WAVE IMSL Statistics procedures RANDOMOPT and RANDOM. The results are shown in
Scattered Data Plot.
; Define the x- and y-coordinates of the vertices.
x = [0, -0.5, -0.5, 0.5, 0.5, 0]
y = [0.5, 0, -1, -1, 0, 0.5]
; Create the filled symbol.
USERSYM, x, y, /Fill
; Generate six random points.
s = 1234567
pts = RANDOMU(s, 6)
; Plot the points, using the new user-defined symbol.
;LOADCT, 0, /Silent
PLOT, pts, Psym=-8, Symsize=4, XRange=[-0.5, 5.5], Xticks=7, $
Background=WoColorConvert(255), Color=WoColorConvert(0)
See Also
System Variables:
!P.PsymPlotting Keywords:
Psym and
Symsize
Version 2017.0
Copyright © 2017, Rogue Wave Software, Inc. All Rights Reserved.

