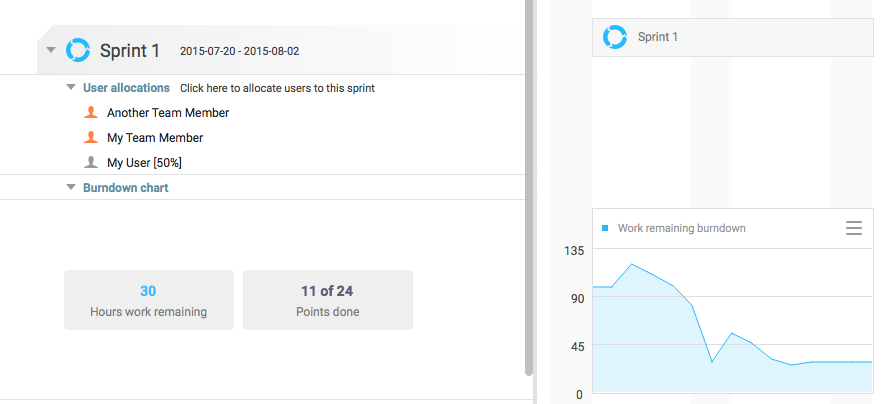
Burndown charts can be an important part of estimating the work in Agile projects. In P4 Plan, you can view burndown charts for both sprints and releases, which show the number of hours of work that remains to be done, and how much progress has been made.
To view the burndown chart, you can do the following
- Sprint burndown chart - Expand the Burndown chart row underneath the sprint.
- Release burndown chart - Make sure that the release's Finish date is in the future, and that it has at least one item tagged to it in the Planning view. You can then expand the release, or use the keyboard shortcut Ctrl + Right arrow, to view the burndown.
In addition to showing the remaining work, you can also set the chart to display more data by clicking the button in the top-right corner. You can choose the following options for both sprints and releases:
- Ideal burndown line - Displays an ideal burndown line, enabling you to compare it to the work remaining. You can customize this line by selecting Set custom start day and value, which enables you to specify the start day of the ideal burndown line as well as the starting value.
- Also showing Points burndown
- Also showing estimated days burndown
The following options are available only for sprint burndown charts:
- Created, changed or deleted work - Enables you to display how work has been added, changed, or deleted during the sprint.
- Work remaining for individual users - Displays work remaining for specific users.
- Work remaining for user groups - Displays work remaining for specific user groups.
- Compare to sprint - Displays another burndown line from a specified sprint, enabling you to compare the two.
- Work remaining on selected items - Displays work remaining for specific items.
- Sprint prediction - For more information, refer to Burndown prediction.
- Remove extra data from chart - Resets the chart to only show work remaining
Burndown prediction
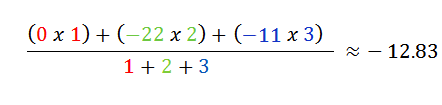
Burndown prediction is calculated using a weighted average. The first thing to be aware of is that P4 Plan ignores free days, such as holidays and weekends, when predicting velocity. These are identified in the timeline with a darker shade of gray.
The following shows an example of how the calculation works:
| Velocity | Day |
|---|---|
| 0 | 1 |
| -22 | 2 |
| -11 | 3 |

The equation would then look something like this when we add values: