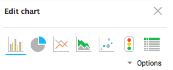
P4 Plan has several types of charts you can add to dashboard pages. You select a chart type when adding a chart and can change the type when editing a chart in the Edit chart pane in the Dashboards area.
| Icon | Chart type | Limitations | Special Options |
|---|---|---|---|

|
Bar |
2 dimensions and 1 measure or 1 dimension and unlimited measures |
|

|
Pie | Up to 3 dimensions and 1 measure |
|

|
Line |
Requires a date column as the first dimension If only time dimensions are used, then unlimited measures can be added Otherwise, it is limited to 4 dimensions and 1 measure |
|

|
Area |
Requires a date column as the first dimension If only time dimensions are used, then unlimited measures can be added Otherwise, it is limited to 4 dimensions and 1 measure |
|

|
XY | 1 dimension and 3 measures | |

|
Gauge | Will take value from the last measure in the list, so is essentially limited to 1 measure |
|

|
Table | Maximum 3 dimensions and unlimited measures |
Each chart type has specific options you can set from the Options menu in the Edit chart pane.
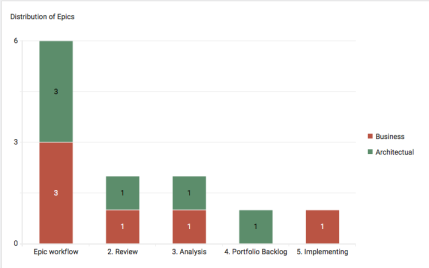
Bar charts support up to two dimensions and any number of measures.
Options
| Option | Select to: |
|---|---|
| Show last updated on | Show or hide the last time the chart was updated. See Showing last updated information on dashboard charts and item views. |
| Show legend | Show or hide names included in the chart. |
| Show labels | Show or hide labels for values in each bar. |
| Vertical bars / Horizontal bars | Use vertical bars or horizontal bars for the data points. |
| Group | Group values represented by bars side by side, stacked, or as a percentage. |
| Set target line | Adds a dotted line to the chart that represents a specified value. Give the line a Name and enter the Value where it should appear. |
| Vertical axis scaling | Enable or disable vertical axis scaling for the chart. Enable scaling to override the minimum and maximum values displayed on the chart Y axis. Disabling scaling uses the minimum and maximum values based on the data in the chart. In the Vertical axis scaling dialog box, select Enable vertical axis scaling. To override the maximum value in the axis, select Override max value and enter a maximum value. To override the minimum value in the axis, select Override min value and enter a minimum value. |
| Theme | Change the color theme for the chart. |
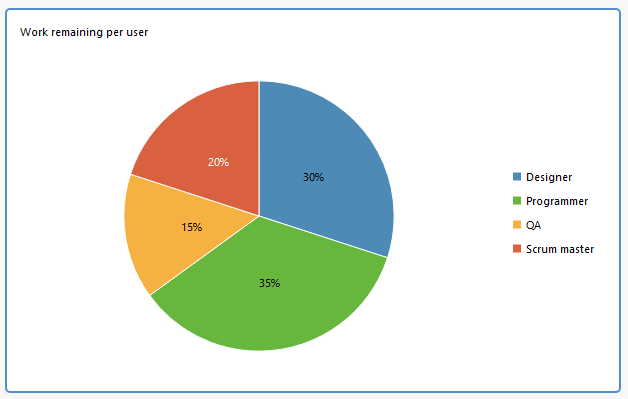
Pie charts support up to three dimensions and use the first measure specified.
Options
| Option | Select to: |
|---|---|
| Show last updated on | Show or hide the last time the chart was updated. See Showing last updated information on dashboard charts and item views. |
| Show legend | Show or hide names included in the chart. |
| Labels | Show or hide various labels in the chart. Labels are not displayed if they do not fit in their pie slice. |
| Theme | Change the color theme for the chart. |
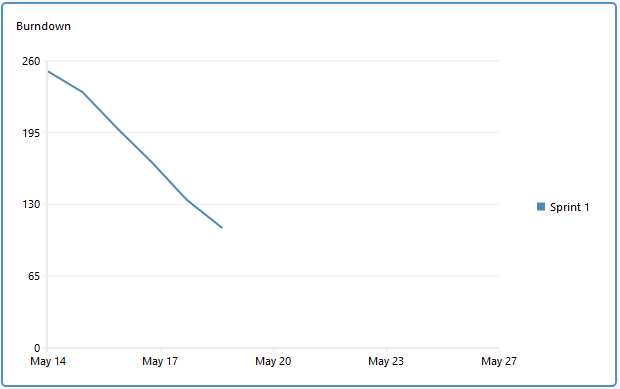
Line charts require a time dimension as the first dimension and support up to three additional dimensions. You can use any number of measures.
Options
| Option | Select to: |
|---|---|
| Show last updated on | Show or hide the last time the chart was updated. See Showing last updated information on dashboard charts and item views. |
| Show legend | Show or hide names included in the chart. |
| Set ideal burndown | Set the ideal burndown line for the chart. |
| Set target line | Adds a dotted line to the chart that represents a specified value. Give the line a Name and enter the Value where it should appear. |
| Vertical axis scaling | Enable or disable vertical axis scaling for the chart. Enable scaling to override the minimum and maximum values displayed on the chart Y axis. Disabling scaling uses the minimum and maximum values based on the data in the chart. In the Vertical axis scaling dialog box, select Enable vertical axis scaling. To override the maximum value in the axis, select Override max value and enter a maximum value. To override the minimum value in the axis, select Override min value and enter a minimum value. |
| Theme | Change the color theme for the chart. |
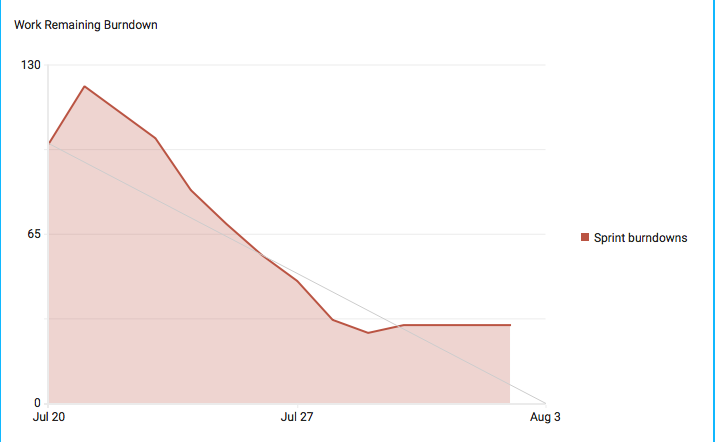
Area charts require a time dimension as the first dimension and support up to three additional dimensions. You can use any number of measures.
Options
| Option | Select to: |
|---|---|
| Show last updated on | Show or hide the last time the chart was updated. See Showing last updated information on dashboard charts and item views. |
| Show legend | Show or hide names included in the chart. |
| Cumulative | Stack graphs on each other in the chart. |
| Set ideal burndown | Set the ideal burndown line for the chart. |
| Set target line | Adds a dotted line to the chart that represents a specified value. Give the line a Name and enter the Value where it should appear. |
| Vertical axis scaling | Enable or disable vertical axis scaling for the chart. Enable scaling to override the minimum and maximum values displayed on the chart Y axis. Disabling scaling uses the minimum and maximum values based on the data in the chart. In the Vertical axis scaling dialog box, select Enable vertical axis scaling. To override the maximum value in the axis, select Override max value and enter a maximum value. To override the minimum value in the axis, select Override min value and enter a minimum value. |
| Theme | Change the color theme for the chart. |
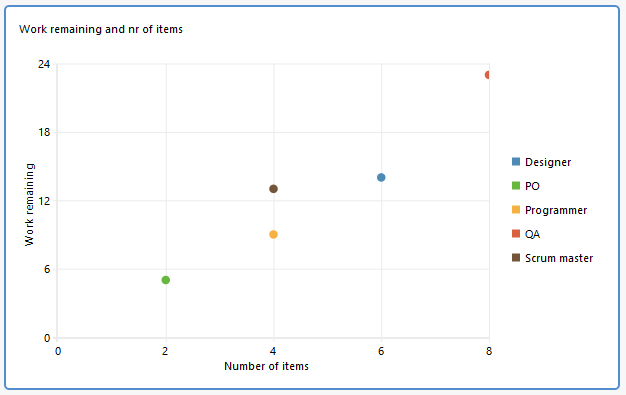
XY charts require two measures. The first measure is used as the X axis and the second measure as the Y axis. You can use up to three dimensions.
Options
| Option | Select to: |
|---|---|
| Show last updated on | Show or hide the last time the chart was updated. See Showing last updated information on dashboard charts and item views. |
| Show legend | Show or hide names included in the chart. |
| Theme | Change the color theme for the chart. |
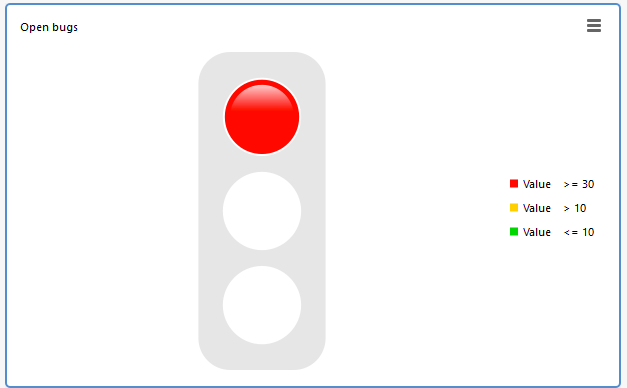
Gauge, or traffic light, charts display red, yellow, or green based on criteria you specify. They require one measure. Additional measures are ignored. If one or more dimensions are specified, the value from the first row (when viewed as a table) is used by the gauge. You can use dimensions and filters to control the exact value a gauge operates on.
Options
| Option | Select to: |
|---|---|
| Show last updated on | Show or hide the last time the chart was updated. See Showing last updated information on dashboard charts and item views. |
| Show legend | Show or hide names included in the chart. |
| Set color bounds | Specify when the light changes color. See Setting gauge dashboard chart color bounds |
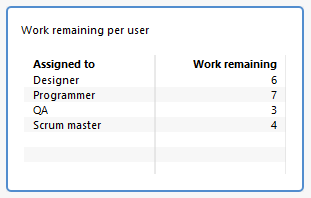
Table charts support up to three dimensions and any number of measures.
Options
| Option | Select to: |
|---|---|
| Show last updated on | Show or hide the last time the chart was updated. See Showing last updated information on dashboard charts and item views. |