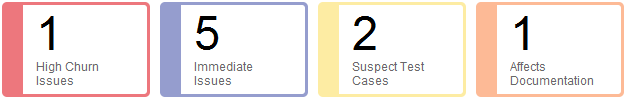
Count widgets are displayed on dashboards and show the total number of items that pass a specific filter. You can click these widgets to go directly to a filtered list of items for quick access to more information.
For example, you can create a count widget that displays the total number of issues with fixes that affect documentation. Documentation team members can use the widget to see how many issues affect documentation and review the issues before they are assigned to a writer.
1. Choose Tools > Administration > Dashboards or Dashboard Widgets. The available option depends on your security permissions.
If you can configure dashboards and widgets, the Configure Dashboards dialog box opens. Click Configure Widgets.
If you can only configure widgets, the Configure Widgets dialog box opens.
2. Click Add and select Count.
You can add a maximum of 100 count widgets.
3. Specify the basic widget information.
4. Configure Color mappings to set the widget border color based on the number of items that pass the selected filter. The default mapping is set to 0 to capture all possible values and cannot be changed or deleted. Select a color from the list or choose Custom to select a custom color.
To specify a new mapping for another value range, click Add, enter the value for when the new color is applied, and select a color. You can add up to 10 mappings per widget. To delete a mapping, select it and click Delete.
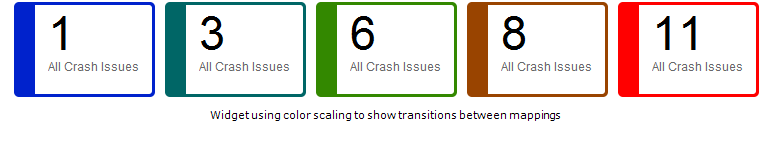
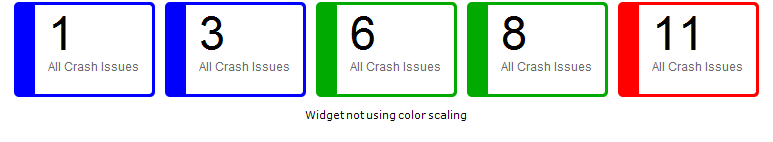
If you add multiple mappings for a widget, select Scale color to show transitions between mappings to gradually change the widget color as the number of items that pass the selected filter transitions between value ranges. For example, the following comparison shows a widget color scaling between mappings for values between 0 and 4 as blue, between 5 and 9 as green, and greater than or equal to 10 as red.
5. Click OK to save the widget.
After saving the widget, add it to a dashboard so users can see it. See Configuring dashboards.
    |

|