Chart widgets are displayed on dashboards and show graphical representations of data to help you analyze project metrics and status.
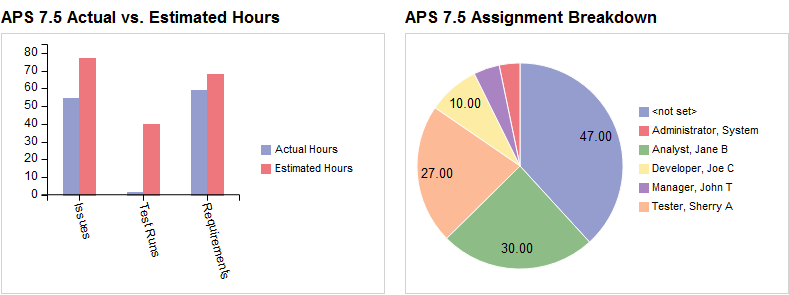
For example, to help managers with future release planning estimates, add a column chart to track the actual versus estimated hours to complete a feature. To help team leads make sure work is evenly distributed, add a pie chart to show a breakdown of items currently assigned to users.
Tip: If you can view or work with reports, you can copy settings from an existing live chart report in the project to use for the widget. Click Copy from Live Chart and select the live chart to copy settings from. See Copying live chart settings to dashboard widgets.
1. Choose Tools > Administration > Dashboards or Dashboard Widgets. The available option depends on your security permissions.
If you can configure dashboards and widgets, the Configure Dashboards dialog box opens. Click Configure Widgets.
If you can only configure widgets, the Configure Widgets dialog box opens.
2. Click Add and select Chart.
You can add a maximum of 100 chart widgets, which also includes burn down and burn up widgets.
3. Specify the basic widget information.
4. On the Type tab, select a chart type in the left pane and then select the chart to use for the widget in the right pane. See Chart types.
5. Click the Source tab to select the data to include in the widget.
6. Click the X-Axis tab to specify the data to display on the chart horizontal axis. See Configuring the dashboard chart widget X-axis.
7. Click the Y-Axis tab to specify the data to display on the chart vertical axis. See Configuring the dashboard chart widgets Y-axis.
8. Click the Legend tab to select where to display the legend relative to the chart.
The legend is displayed to the right of the chart by default, but you can also display it at the bottom.
9. Click Preview to preview the widget to make sure you configured it correctly.
10. Click OK to save the widget.
After saving the widget, add it to a dashboard so users can see it. See Configuring dashboards.
You can add the following chart types as widgets.
| Chart type | Description |
|---|---|
| Area | Displays data points plotted on lines with shading in the area between the axis and lines. Multiple series are displayed in layers or stacked. Useful for evaluating changes over time and identifying trends. |
| Bar | Displays rectangular bars for each series that are sized based on the values they represent. Same as column charts except the bars are horizontal. Multiple series are displayed in layers or stacked. Useful for evaluating changes over time and comparing categories of data. |
| Column | Displays rectangular bars for each series that are sized based on the values they represent. Same as bar charts except the bars are vertical. Multiple series are displayed in layers or stacked. Useful for evaluating changes over time and comparing categories of data. |
| Combo | Displays multiple series using a combination of column, line, area, and scatter chart types. The chart type for each series is selected in the Configure Series area on the Y-Axis tab when setting the horizontal axis options for the chart. Useful for clearly differentiating multiple data categories. |
| Line | Displays data points plotted on lines. Multiple series are displayed on multiple lines. Useful for displaying continuous data over time and evaluating data trends in equal intervals, such as weeks or months. |
| Pie | Displays data points in slices that represent a percentage of the whole pie. Data can be displayed in a flat pie or a donut. Useful for comparing groups of data. |
| Scatter | Displays a symbol to represent each data point. Useful for evaluating relationships between values in multiple data categories. |
    |

|