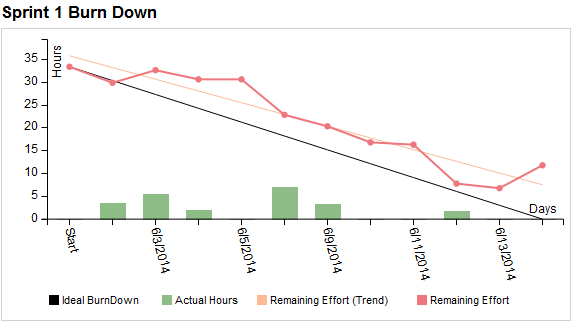
Burn down charts are commonly used in Agile to show work left to do versus time available for a sprint, iteration, release, or project phase. Use burn down widgets on dashboards to monitor progress during a specified planning period and quickly see if the remaining work will complete on time.
Note: Time tracking must be used in the project to provide data for burn down widgets. See Configuring time tracking.
1. Choose Tools > Administration > Dashboards or Dashboard Widgets. The available option depends on your security permissions.
If you can configure dashboards and widgets, the Configure Dashboards dialog box opens. Click Configure Widgets.
If you can only configure widgets, the Configure Widgets dialog box opens.
2. Click Add and select Burn Down.
You can add a maximum of 100 chart widgets, which also includes burn up and other chart widgets.
3. Specify the basic widget information.
4. Select a Time tracking fields option to show the planned and completed work.
Note: Users must have access to view the time tracking fields to see burn down data. To see data in hours, the selected security group must have read/write or read only access for the Actual Hours, Estimated Hours, and Remaining Hours fields. To see data in story points, the selected security group must have read/write or read only access to the Story Points field. See Managing security groups.
5. Select a Units option to show the time available to complete the work. You can use days, weeks, or months relative to the specified planning period.
6. Select Filter items to only include the selected item types in the chart.
Optionally select a filter for each selected item type to only include filtered items in the chart or select Add filter to create a new filter. See Adding filters. Interactive filters and filters with <current user> restrictions are not available for widgets.
7. Optionally select a Folder that contains the items to include. Click Browse to select the folder.
8. Specify the Planning information for the time period to use for calculating the time available to work on a release, iteration, or project phase. If you selected a folder with release planning enabled, you can choose to use the release planning information configured for it.
9. Click OK to save the widget.
After saving the widget, add it to a dashboard so users can see it. See Configuring dashboards.
    |

|