The Scales page lets you define the scales used in the current chart. A chart can have one abscissa scale and as many ordinate scales as you want.
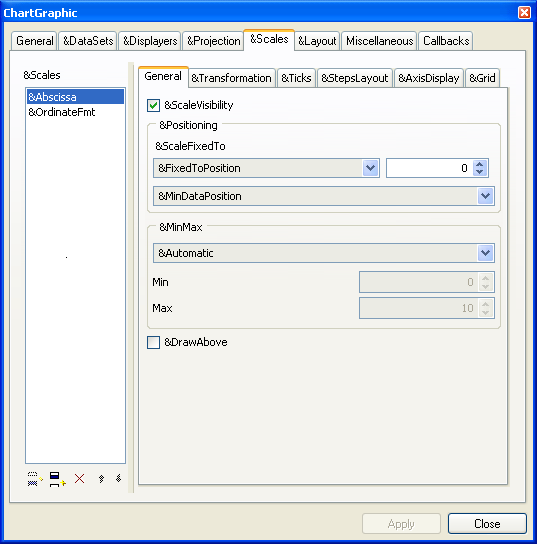
Chart Inspector: Scales Page
The Scales page is divided into several subpages that allow you to set various parameters for the selected scale.
-
-
the position of the scale. The scale can be fixed to a data value or to a relative position expressed in pixels.
-
the minimum and maximum data values represented by the scale.
-
-
The transformations that can be applied are composed of an elementary transformation, optionally followed by a logarithmic transformation. If you want to apply a transformation to the data, you must first select a defined elementary transformation from the drop-down list. Optionally, you can then set a logarithmic transformation. If you want to apply a logarithmic transformation but you do not want to apply a particular elementary transformation before, just select Identity in the drop-down list showing the defined elementary transformations.
-
The term “step” refers to the main graduations of a scale and the term “substep” refers to the secondary graduations of the scale. The term “tick” refers to the marks that are drawn on a scale axis at each step and substep. Major ticks are drawn at each step and minor ticks are drawn at each substep. Labels indicating data values are drawn only for the steps of a scale.