General Architecture of the Charts Library
The general architecture of the Charts Library in Views is based on the model-view separation concept. The Charts Library has been designed with a clear separation between the data and the graphical representations of the data. There is a clear distinction between:
-
the chart data objects that manage the sets of data (or data sets) to be displayed by the charts and
Listeners are set on data so that the chart objects can be updated automatically when modifications are made to the data they display.
Basic Rules
The following basic rules apply to chart data objects and chart objects:
-
The same chart data object can be displayed by several chart objects.
-
A given chart object can display only one chart data object.
-
A given data set managed by a chart data object can be displayed with several different graphical representations in a chart object.
Example Charts
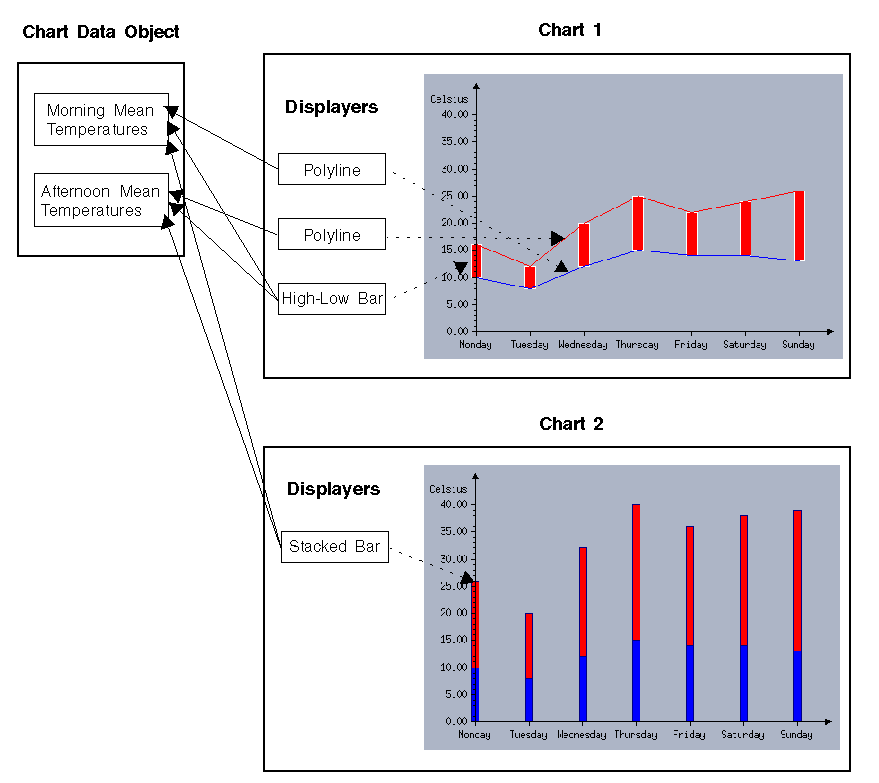
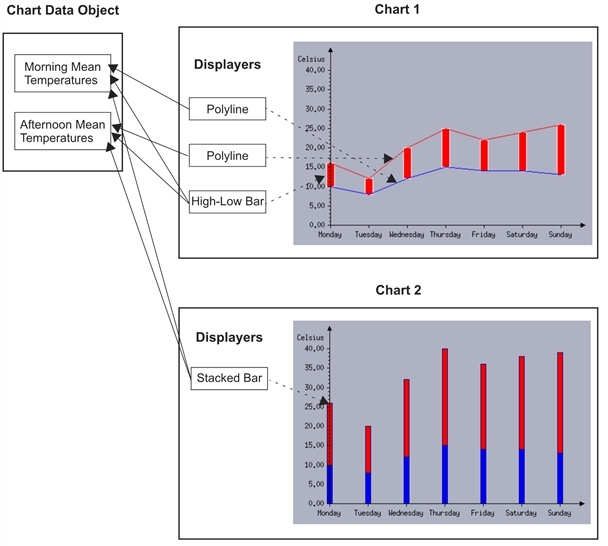
The two charts shown in Two Charts using the Same Chart Data Object will help you understand these basic rules. Each chart displays a set of mean temperatures for the morning and a set of mean temperatures for the afternoon recorded for each day of a week. However, the charts use a different type of graphical representation to display the same data. These two charts display the same chart data object that manages the two sets of temperatures.
-
Chart 1 displays the morning and afternoon mean temperatures with two polylines. The two sets of temperatures are also displayed on the chart with high-low bars to illustrate the variation of the temperatures between the morning and the afternoon of each day of the week.
-
Chart 2 displays the two sets of temperatures with stacked bars in order to illustrate the mean temperature for each day of the week.
In both charts, the abscissa scale indicates the days of the week and the ordinate scale the temperatures in degrees Celsius.
The drawing of the graphical representations of data (polylines, high-low bars, and so on) is performed within a chart by dedicated objects called displayers. Two Charts using the Same Chart Data Object shows the displayers used by the two charts to represent the morning and afternoon mean temperatures data sets. The solid-line arrows indicate the data set(s) that each displayer displays. The dotted-line arrows indicate the graphical representation that is displayed by each displayer.

