What is a Chart?
A chart represents data graphically in different forms (markers, lines, bars, and so on) with scales that are added to indicate the values of the displayed data. We distinguish two kinds of charts:
-
Cartesian charts represent data in a standard way. The data is expressed using a Cartesian system of coordinates (x, y). The x- and y-coordinates are plotted along the abscissa and ordinate scales, respectively. The scales are rectangular and are displayed orthogonally.

A Cartesian Chart
-
Polar charts represent data in a circular way. The data is expressed using a polar system of coordinates (q, r). The abscissa values q are plotted along a circular scale. The ordinate scale, along which the r-coordinates are plotted, is rectangular and is displayed radially.
A Polar Chart
In addition, other elements can be added to a chart to aid in the understanding of the displayed data:
-
Legends that explain the displayed data (see A Grid and a Legend in a Cartesian Chart )
-
Grids to help you locate the data points on a chart (see A Grid and a Legend in a Cartesian Chart )
-
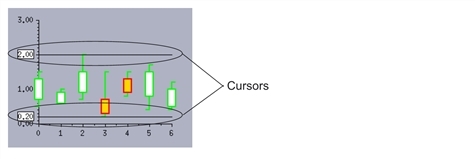
Cursors that show the values of a given data point on the scales (see Cursors in a Cartesian Chart)
-
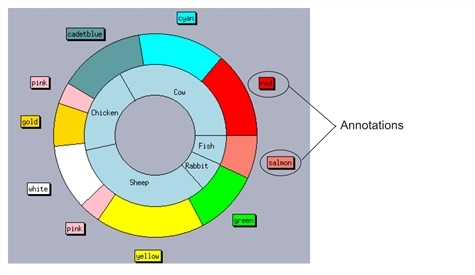
Annotation linked to a given data point (see Annotations on a Pie Chart )

A Grid and a Legend in a Cartesian Chart