Scatter Displayer
A scatter displayer has the following
|
Class |
|
|
Category |
Single |
|
Number of real data sets displayed |
1 |
|
Can be used with all types of projections |
Yes |
|
Items drawn |
Markers |

The following properties are specific to a scatter displayer:
|
Property |
Methods |
Default Value |
|
Marker Type |
getMarker setMarker |
IlvMarkerFilledSquare |
|
Marker Size |
getMarkerSize setMarkerSize |
IlvDefaultMarkerSize |
Scatter Displayers in a Cartesian Chart and in a Polar Chart illustrates the fact that a scatter displayer can be used with all types of projections. Data sets are represented by scatter displayers in a Cartesian chart (using a Cartesian projection) and in a polar chart (using a polar projection).
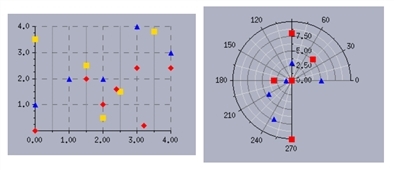
Scatter Displayers in a Cartesian Chart and in a Polar Chart
We can use the scatter displayer displaying the blue triangles as an example. We can create this displayer by using the following code:
|
IlvScatterChartDisplayer* displayer = new IlvScatterChartDisplayer(IlvMarkerFilledTriangle, IlvDefaultMarkerSize); displayer->setForeground(dpy->getColor("blue")); |
The Drawn Filled property has no meaning for a scatter displayer. The markers are simply drawn with the foreground color of the defined palette.