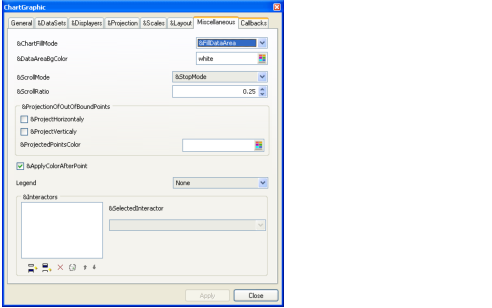
Miscellaneous Page
The Miscellaneous page lets you define several parameters that affect the whole chart. The Miscellaneous page appears as follows:

Chart Inspector: Miscellaneous Page
On this page, you can do the following:
Note: If the filling mode is set to “Filled data and graph areas”, the graph area will be filled with the background color of the chart palette. |
Three scroll modes are available:
If you specify a vertical or horizontal projection, the out-of-bounds data points are projected on the limits of the data display area. This feature is available for continuous data representations, such as polylines. The effect of the projection is to fill the parts of the polyline that are not drawn because they are outside the data display area. You can also associate a specific palette to represent the projected data points.
The Views Charts package allows you to define a specific palette that will be applied to a given data point. This palette is independent of the palette that is applied to the whole graphical representation of the data set to which the data point belongs. This specific palette can only be defined by code. (See Adding Graphic Information to a Data Point for more details.)
The parameter specifying whether the specific palette is applied before or after the data point can be used only for those displayers for which there is a continuous graphical representation linking several data points (such as polyline displayers, step displayers, and so on). For displayers for which there is a graphical representation by data point (such as scatter displayers, bar displayers, and so on), the specific palette is simply applied to the graphical representation of the data point.
Several interactors can be set on the same chart. The different interactors that are set are considered in the order they appear in the list showing the interactors set for the current chart. The order in which the interactors appear in the list indicate the priority for event dispatching.
Notes: |
1. For the defined interactors to work, the Chart interactor must be set on the General Page of the Chart inspector. |
2. You must be in Test mode, and for this the GUI Application plug-in must have been loaded. To go into Test mode, click the Test icon |
3. The ChartInfoView interactor works only if the buffer that contains the chart is a Gadgets or Prototype Instances (Gadgets) buffer. To see the types of buffers that can be created, choose New from the File menu at the top of the Main window. |
Published date: 05/24/2022
Last modified date: 02/24/2022


