A Quick Look at the Interface
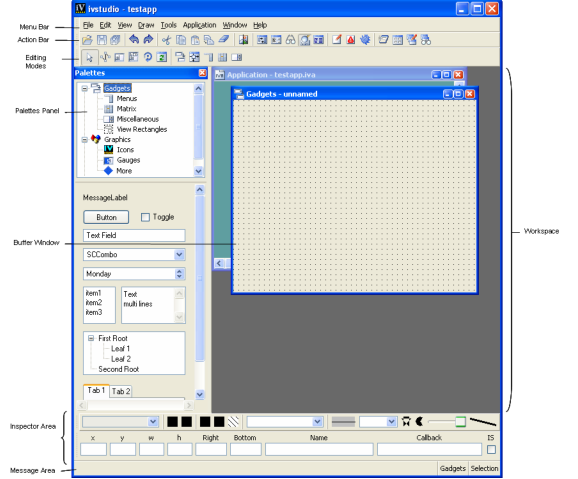
When you launch Views Studio with the Charts extension, the Main window with the Palettes panel appears on your screen.

The work space on the right of the Main window contains the buffer window(s) created by default. You will use these buffer windows to drag and drop chart objects from the Charts palette. You can use the buffer window on top (the Gadgets buffer window), or create another buffer window by selecting New from the File menu.

The Palettes panel on the left displays the palettes of predefined graphic objects available in Views. The upper pane displays a tree gadget with various items, each corresponding to a particular graphic palette. The lower pane displays the objects contained in the palette selected from the tree.
Main Window at Start Up
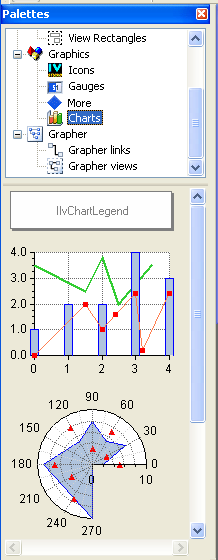
Scrolling down the tree in the upper pane of the Palettes Panel, you see Charts, a subitem of Graphics. When you click Charts, you display the Charts palette in the lower pane.
Charts Palette
The Charts palette contains the following objects:

A chart legend object, which is an instance of the
IlvChartLegend class. You will use this object to add legends to your charts. The legend object that appears in the palette displays only the name of the class. Legend items will be displayed when the legend object is connected to a chart.

Several chart objects, which are all instances of the
IlvChartGraphic class. These chart objects differ only in the way that they have been customized. Three examples of charts are provided in the palette:
 Cartesian chart:
 this is a chart object that has been customized to display data expressed in Cartesian coordinates in a standard way.
 Polar chart:
 this is a chart object that has been customized to display data expressed in polar coordinates in a circular way.
 Pie chart:
 this is a chart object that has been customized to display a pie.
Published date: 05/24/2022
Last modified date: 02/24/2022


