Using Logarithmic Scales
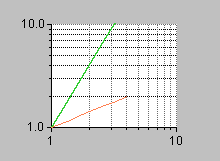
This section explains how to use logarithmic scales. The procedure is based on the previous example where you created a Cartesian chart to represent the square and square root functions. Starting from that chart, you are going to customize the abscissa scale and the ordinate scale to obtain the following chart:
Using Logarithmic Scales
In this part of the example, you will see how to do the following tasks:

Define a logarithmic transformation to be applied to the data values represented by a scale.

Customize a grid associated with a scale.
Customizing the Abscissa Scale
To customize the abscissa scale for this example, you are going to apply a transformation to the data values represented by the scale. You are also going to customize the associated grid.
Applying a Transformation
1. Click the Scales tab in the Chart inspector to bring this page to the front.
Abscissa should be selected by default in the Scales list. The right part of the window is divided into several subpages that describe the properties of the selected scale.
2. Click the Transformation tab of the Scales page.
By default, no transformation is defined. Defining a transformation consists of applying an elementary transformation first, optionally followed by a logarithmic transformation. For this example, we want to apply only a logarithmic transformation so we are going to set the identity as the elementary transformation.
3. Select Identity in the Elementary transformation drop-down list.
4. Click “Logarithmic transformation” and enter 10 as the logarithmic base.
5. Click Apply to validate the changes.
Customizing the Grid
To customize the grid associated with the selected scale, do the following:
1. On the Scales page, click the Grid tab to bring this subpage to the front.
The Grid subpage is where you can customize the grid associated with the current scale.
2. Make sure the “Use a grid” toggle is checked.
3. To specify grid lines for both the major and the minor ticks, make sure the option “Draw major lines only” is deselected.
4. Click Apply to validate the changes.
Customizing the Ordinate Scale
To customize the ordinate scale for this example, you are going to apply a transformation to the data values represented by the scale. You are also going to customize the associated grid.
The Scales page of the Chart inspector should already be selected so you can continue with the following steps.
Applying a Transformation
1. Select Ordinate 1 in the Scales list of the Scales page.
2. Select the Transformation subpage.
This is where you are going to define the transformation you want to apply to the data.
3. Select Identity in the Elementary transformation drop-down list.
4. Click “Logarithmic transformation” and enter 10 as the logarithmic base.
5. Click Apply to validate the changes.
Customizing the Grid
To customize the grid associated with the selected scale, do the following:
1. Select the Grid page on the Scales page.
This page lets you customize the grid associated with the current scale.
2. Make sure the “Use a grid” toggle is checked.
3. To specify grid lines for both the major and the minor ticks, make sure the option “Draw major lines only” is deselected.
4. Click the colored icon at the right end of the Minor palette field.
The Resources panel opens.
5. Choose “alternate” from the Line Style drop-down list.
6. Click Apply to validate the changes in the Resources panel and then Close to close the Resources panel.
7. Click Apply in the Chart inspector to validate the changes to the chart.
You can now check your resulting chart. It should look like this:
Version 6.1
Copyright © 2016, Rogue Wave Software, Inc. All Rights Reserved.


