Rogue Wave Views Charts
The Rogue Wave® Views Charts package is a powerful package for data visualization. This package allows you to display both predefined data or real-time data in highly customizable Cartesian and polar charts.
Main Charts Features
The Charts package includes these features:
 Numerous chart representations
: Available chart representations are: scatter, polyline, polygon, marked polyline, bar, 3D bar, step, stair, high-low representation, pie, side by side bars, stacked bars, stacked 3D bars, and stacked polygons.
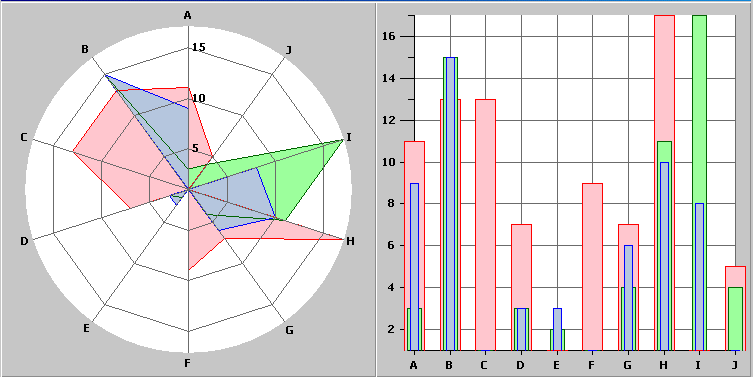
 Cartesian or polar representation
: These allow you to display data in a standard way or in a circular way, respectively. You can jump easily from one representation to another.
 Data-aware charts
: Perfectly adapted for real-time monitoring.
 Automatic management of scrolling
: With several modes (stop, shift, cyclic).
 Predefined interactors
: For zooming in, selecting data points, and other actions.
 Logarithmic scales for each axis
.
 Multiple ordinate scales
: You can add as many ordinate scales as you want (you can have only one abscissa axis).
 Selectable scales orientation
: In Cartesian charts, the abscissa and ordinate scales can be oriented either horizontally or vertically. In polar charts, the circular abscissa scale can be oriented clockwise or counterclockwise, and the radial ordinate scales can be oriented at any angle.
 Charts legend and grid management
.
 Script integration for function definition
: You can use Rogue Wave Script, for example, to define a math function displayed on a chart.
 Full integration in
 Rogue Wave Views
Studio: This allows you to create and customize charts without having to code.
Examples: A Polar Chart and a Cartesian Chart
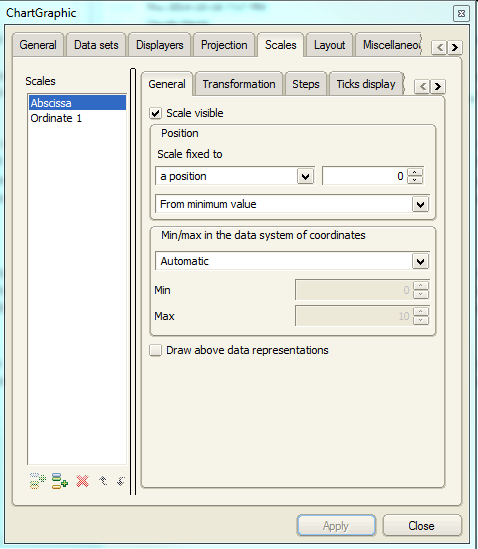
Studio Chart Inspector Lets You Change Everything On a Chart
Prerequisite Packages:
Foundation,
Studio.
Version 6.1
Copyright © 2016, Rogue Wave Software, Inc. All Rights Reserved.

