Drawing the Scales of a Chart
A scale is displayed within a chart by a dedicated object called a scale displayer.
The base class used to represent a scale displayer is the
IlvAbstractScaleDisplayer class.
A subclass is provided called IlvSingleScaleDisplayer. This class represents a single coordinate on an axis.
The single scales representing several ordinate coordinates can be stacked in order to represent them on the same axis.
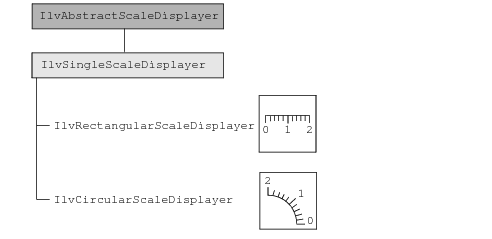
Figure 9.1 shows the hierarchy of all the scale displayers defined in the Charts Library.
Figure 9.1 Hierarchy of Scale Displayers in the Charts Library
Version 5.8
Copyright © 2014, Rogue Wave Software, Inc. All Rights Reserved.