Customizing the Ordinate Scale
The last task of this exercise consists of customizing the ordinate scale. The Scales page should already be selected in the Chart inspector, so you can continue with this task.
1. Select Ordinate 1 in the Scales list.
2. Click the General tab of the Scales page.
This is where you set the minimum and maximum data values that will be represented on this scale.
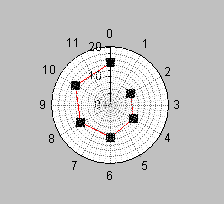
The minimum and maximum values must include all the data ordinate values, that is, all the recorded temperatures. These temperatures range from 8 to 15 degrees. The minimum value of the scale must therefore be no more than 8 and the maximum value no less than 15, if you want to make sure that all the temperature values in
Table 3.1 are displayed. Moreover, it is common practice to use round values.
3. Enter 0 in the Min field and 20 in the Max field.
4. Click Apply to validate the changes.
The resulting chart should now appear as follows:
You have now completed all the examples to help you get started using Rogue Wave® Views Studio with the Charts extension. You have learned the basic procedures for creating and customizing Cartesian and polar charts. You should be able to begin creating your own charts using Rogue Wave Views Studio.
In Part 2 of this manual, you will find detailed information on using the Charts Library.
Version 5.8
Copyright © 2014, Rogue Wave Software, Inc. All Rights Reserved.